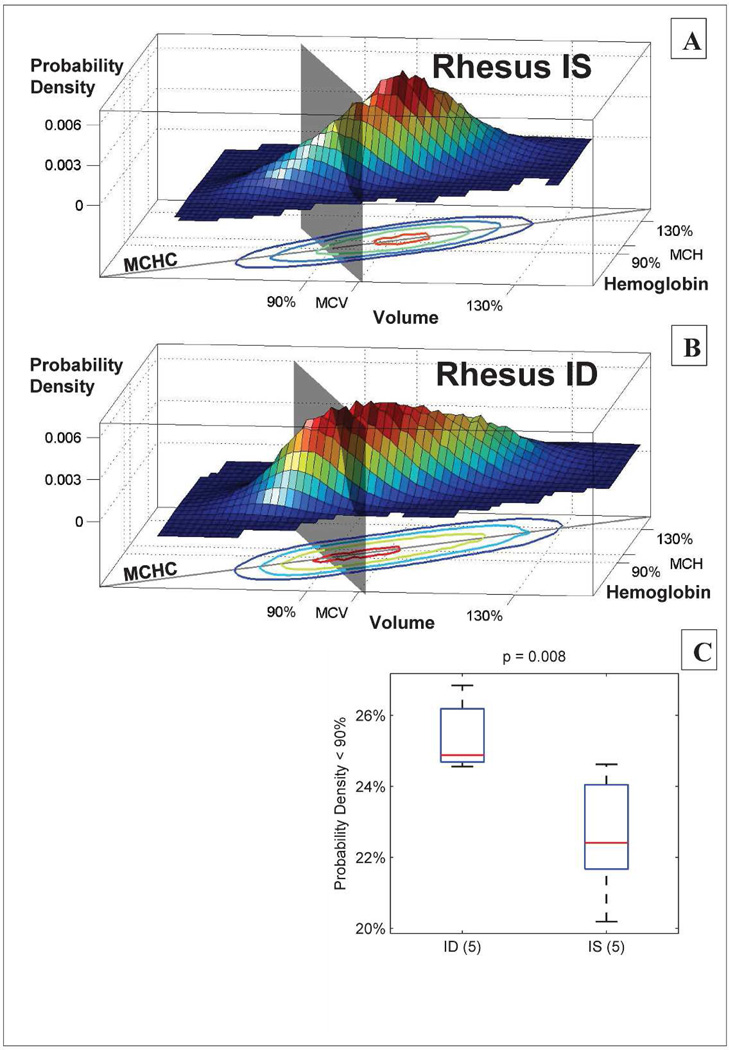
Figure 3. In utero iron deficiency is associated with persistent delay in RBC clearance in two-year-old rhesus monkeys.
Panels A and B show the single-RBC volume and hemoglobin distributions for an IS (panel A) and an ID (panel B) animal. A gray plane divides the populations at 90% of the MCV and MCH. In the IS RBC population, 21% of the circulating RBCs are located between the plane and origin at steady state, as compared to 27% in the ID animal. Panel C shows that this difference between the ID (5 animals) and IS (5 animals) groups is significant with a p-value of 0.008 (one-sided rank sum test), supporting the conclusion that in utero iron deprivation causes a long-lasting delay in RBC clearance with more low volume and hemoglobin cells in the ID animals. The “MCHC” lines in A and B show the mean single-RBC hemoglobin concentration. Contour lines in A and B enclose 90%, 75%, 50%, and 12.5% of cells.

