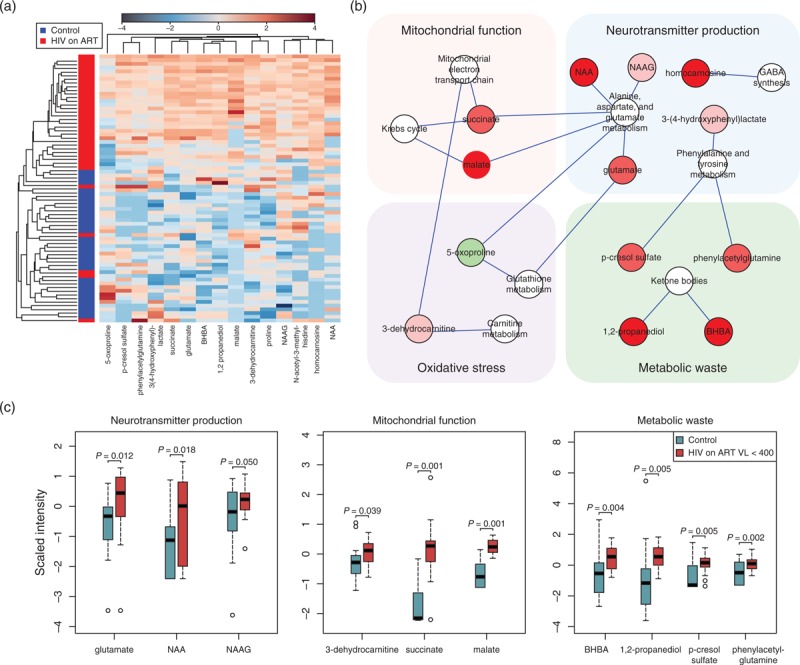
Fig. 1.
Cerebrospinal fluid metabolomics identifies metabolites that distinguish HIV patients on antiretroviral therapy from HIV-negative controls.

(a) Unsupervised hierarchical clustering of signature metabolites (n = 15; FC >1.2, P < 0.01, FDR <10%) altered in HIV patients on ART (n = 36, red) compared to age and sex-matched HIV-negative controls (n = 36, blue). Red and blue indicate increased and decreased metabolite levels, respectively. FDR was used to correct for multiple hypothesis testing. (b) Metabolites altered in HIV patients on ART compared to HIV-negative controls mapped to biosynthetic pathways linked to production of neurotransmitters, mitochondrial dysfunction, oxidative stress, and metabolic waste products. Altered metabolites (FC >1.2, P < 0.01, FDR <10%) were mapped to metabolite pathways and interaction networks were generated in Cytoscape. Green and red nodes represent metabolites with increased and decreased levels, respectively. White nodes represent pathways. (c) Box plots of metabolites altered in HIV patients on ART with low plasma viral loads (n = 20, plasma VL <400 copies/ml, CSF VL <50 copies/ml) compared to age and sex-matched HIV-negative controls (n = 20) that could be mapped to biological processes associated with NCI. Medians are represented by horizontal bars, boxes span the interquartile range (IQR) and whiskers extend to extreme data points within 1.5 times IQR. Outliers plotted as open circles lie outside 1.5 times the IQR. Blue and red represent controls and HIV patients, respectively. The P-values were calculated using Welch's t-tests. ART, antiretroviral therapy; BHBA, beta-hydroxybutyric acid; CSF, cerebrospinal fluid; FC, fold change; FDR, false discovery rate; GABA, gamma-aminobutyric acid; NAA, N-acetylaspartate; NAAG, N-acetylaspartylglutamate; NCL, neurocognitive impairment; VL, viral load.
