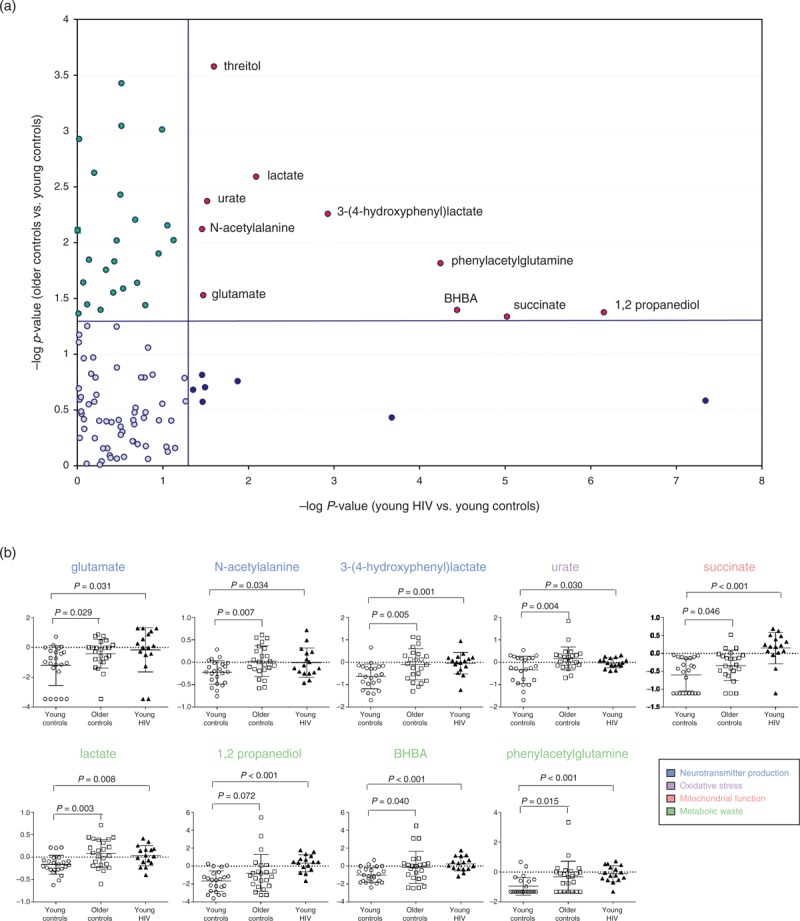
Fig. 3.
Metabolites altered in the cerebrospinal fluid metabolome of young HIV patients on antiretroviral therapy overlap with those altered in older HIV-negative controls.

(a) P-value scatter plot of metabolites altered in the HIV CSF metabolome (16 young HIV patients on ART vs. 23 young HIV-negative controls) vs. metabolites altered during normal aging in HIV-negative controls (23 older vs. 23 young HIV-negative controls). The Y-axis shows –log10P-values of metabolites altered in older (≥50 years old) vs. young HIV-negative controls (<50 years old) matched for sex and race. The X-axis shows –log10P-values of metabolites altered in young HIV patients on ART (<50 years old) with viral loads (plasma VL <1000 copies/ml, CSF VL <50 copies/ml) vs. young HIV-negative controls (≥50 years old) matched for age and sex. (b) Beeswarm plots of metabolites altered in young HIV patients on ART (<50 years old, n = 16) compared to young (<50 years old, n = 23) and older HIV-negative controls (≥50 years old, n = 23). Medians are represented by horizontal bars. The P-values were calculated using Welch's t-tests. ART, antiretroviral therapy; BHBA, beta-hydroxybutyric acid; CSF, cerebrospinal fluid; VL, viral load.
