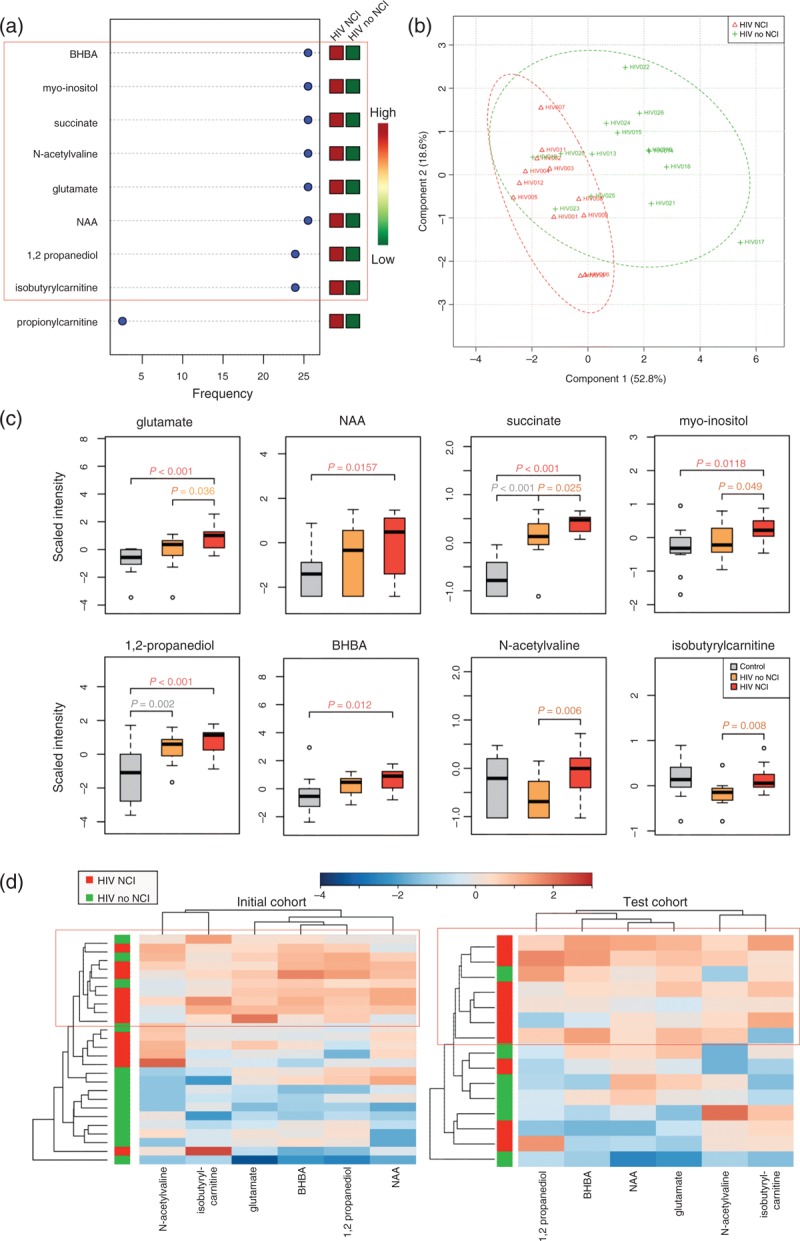
Fig. 4.
Cerebrospinal fluid metabolites associated with neurocognitive impairment in HIV patients on antiretroviral therapy.

(a) Top classifiers of NCI with expression heatmap from recursive SVM classification models. SVM models were constructed using metabolites identified in FC analysis (FC >1.2, P < 0.05, FDR <10%) comparing HIV patients on ART with NCI (plasma VL <10 000 copies/ml), HIV patients on ART without NCI (plasma VL <10 000 copies/ml), and age and sex-matched HIV-negative controls. Red and green indicate increased and decreased levels, respectively. (b) PLS-DA analysis shows separation of metabolomes from HIV patients on ART with (red, n = 12) and without NCI (green, n = 14). (c) Box plots of top classifiers of NCI identified by SVM in HIV-negative controls (n = 14, gray), HIV patients on ART without NCI (n = 14, orange), and HIV patients on ART with NCI (n = 12, red). Medians are represented by horizontal bars, boxes span the interquartile range (IQR) and whiskers extend to extreme data points. The P-values were calculated using Welch's t-tests. (d) Unsupervised hierarchical clustering of six top-ranked metabolites that distinguish between HIV patients on ART with and without NCI in two independent cohorts. The initial cohort was composed of HIV patients on ART with low viral loads (n = 26, plasma VL <10 000 copies/ml, CSF VL <50 copies/ml). The independent test cohort was composed of HIV patients with high plasma viral loads (n = 15, VL >10 000 copies/ml). Red and blue indicate increased and decreased levels, respectively. ART, antiretroviral therapy; BHBA, beta-hydroxybutyric acid; CSF, cerebrospinal fluid; FC, fold change; FDR, false discovery rate; NAA, N-acetylaspartate; NCL, neurocognitive impairment; PLS-DA, partial least-squares discriminant analysis; SVM, support vector machine; VL, viral load.
