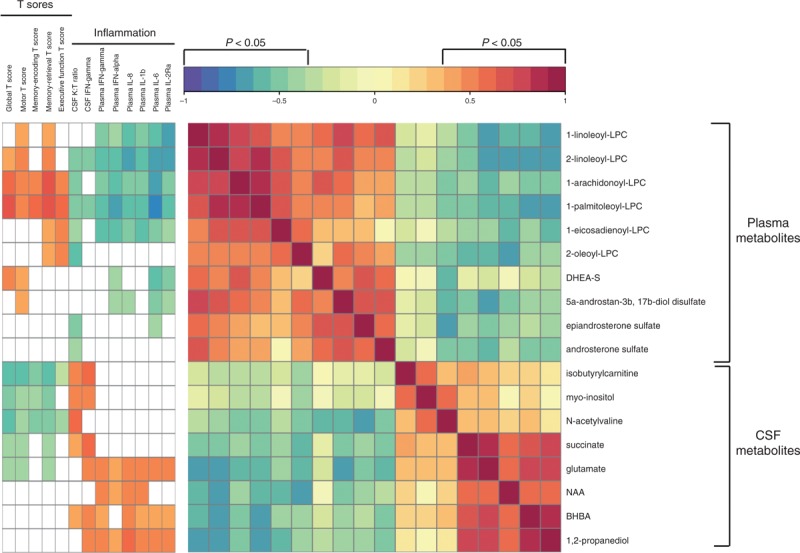
Fig. 5.
Integrative analysis and correlation matrix visualization reveals relationships between cerebrospinal fluid classifiers of neurocognitive impairment, plasma lysophosphocholines and steroids, global and domain T scores, and markers of systemic and intrathecal inflammation in HIV patients on antiretroviral therapy.

The correlation matrix and clinical covariate bar were constructed in R using the heatmap.2 function. Pearson correlations were used to evaluate relationships between metabolites (P <0.05, FDR ≤0.1). Spearman correlations were used to examine relationships between metabolites, global and domain T scores, and markers of inflammation. Significant correlations had a −0.35 > r > 0.35 (P < 0.05), and FDR below 10%. FDR was used to correct for multiple hypothesis testing. Red and blue indicate positive and negative correlations, respectively (see Color Key). BHBA, beta-hydroxybutyric acid; DHEA-S, dehydroepiandrosterone sulfate; FDR, false discovery rate; LPC, lysophosphocholine; NAA, N-acetylaspartate.
