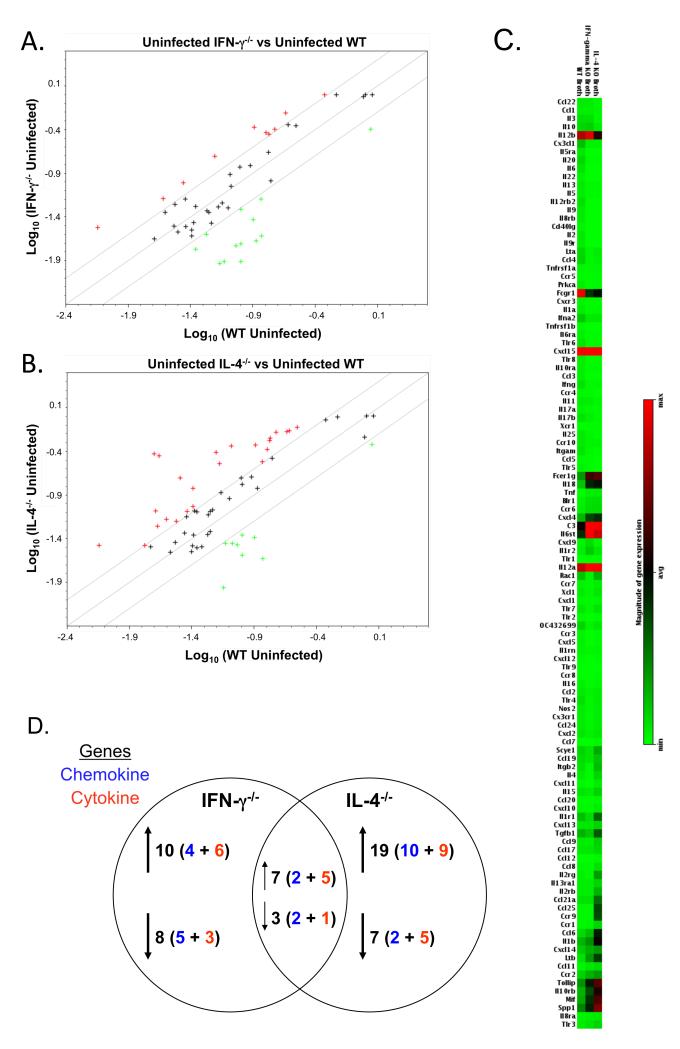
Figure 1. Cytokine mRNA expression differs in the lungs of uninfected wild-type and cytokine-deficient mice.
Lungs were obtained from broth-inoculated (uninfected) wild-type, IFN-γ−/− and IL-4−/− mice. Total RNA was isolated from the lungs of individual mice. Equal amounts of RNA from individual mice (3 or 4 mice/experiment) from each experiment were pooled and used to probe membrane-based cDNA cytokine/chemokine microarrays. Data represent the average value of normalized spot intensities obtained from arrays from 2 different experiments. The results from the RNA obtained from the lungs of uninfected IFN-γ−/− and IL-4−/− mice were compared to the RNA obtained from the lungs of uninfected wild-type mice. Scatterplots represent gene expression in the lungs of (A) IFN-γ−/− versus wild-type mice and (B) IL-4−/− versus wild-type mice. A boundary of 2-fold change in either direction was selected. Green plus (+) signs located above the boundary line indicate an increase in gene expression, greater than boundary value, whereas red plus (+) signs below the boundary line indicate a decrease in gene expression. The further the sign is from the 2-fold boundary line, the greater the fold difference. Plus signs within the boundary lines mean the fold change were considered not significant. Each symbol represents one gene. (C) Relative gene expression was plotted as a gradient of colors from light green (minimum expression) to bright red (maximum expression) for the lungs of uninfected wild-type, IFN-γ−/− and IL-4−/− mice. (D) Summary of number of genes changing in the lungs of uninfected IFN-γ−/− and IL-4−/− mice as compared to uninfected wild-type mice. Changes in gene expression are reported only if there was at least an average of ≥ 2-fold difference, with no value of ≤1.5 fold in either individual experiment. Chi square analysis was used to compare the distribution of gene expression changes between groups of mice. There was a significantly different change in the distribution gene expression between IFN-γ−/− and IL-4−/− mice (p ≤ 0.001).

