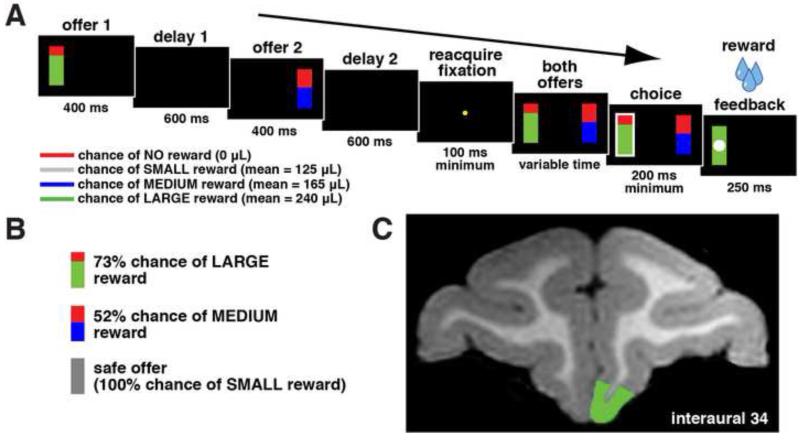
Figure 1.
Task and recording location. A. Timeline of gambling task. Two options were presented, each offering a gamble for water reward. Each gamble was represented by a rectangle, some proportion of which was grey, blue, or green, signifying a small, medium, or large reward respectively. The size of this colored region indicated the probability that choosing that offer would yield the corresponding reward. Offers appeared in sequence, offset by one second and in a random order for 400 ms each. Then, after fixation, both offers reappeared during a decision phase. Outcomes that yielded rewards were accompanied by a visual cue: a white circle in the center of the chosen offer. B. Example offers. Probabilities for blue and green offers were drawn from a uniform distribution between 0 and 100% by 1% increments. Gray (safe) offers were always associated with a 100% chance for reward. C. Magnetic resonance image of monkey B. Recordings were made in area 14 of vmPFC (highlighted in green).

