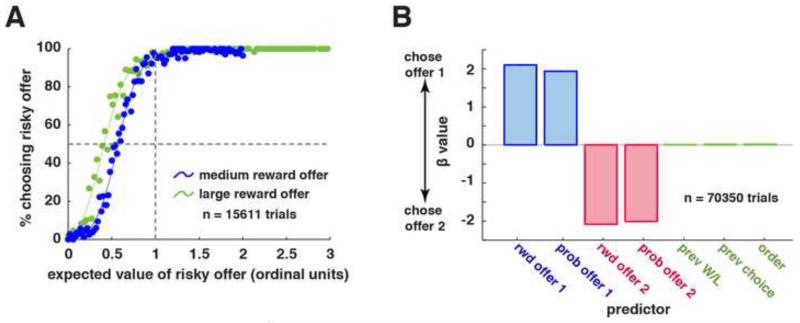
Figure 2.
Behavioral results. A. Likelihood of choosing risky offer instead of a safe one as a function of risky offer expected value. Data are separated for high value (green) and medium value (blue) gambles. Fits are made with a lowess smoothing function. Expected values are calculated in units of ordinal expected value (see Methods). B. Effects of seven trial variables on choice (offer 1 vs. 2) using a logistic GLM. Tested variables are: (1) the reward and (2) probability for offer 1, the (3) reward and (4) probability for offer 2, (5) the outcome of the most recent trial (win or choose safe = 1, loss = 0), (6) the previous choice (first = 1, second = 0), and (7) the order of presentation of offers (left first = 1, right first = 0). Error bars in all cases are smaller than the border of the bar, and are therefore not shown.

