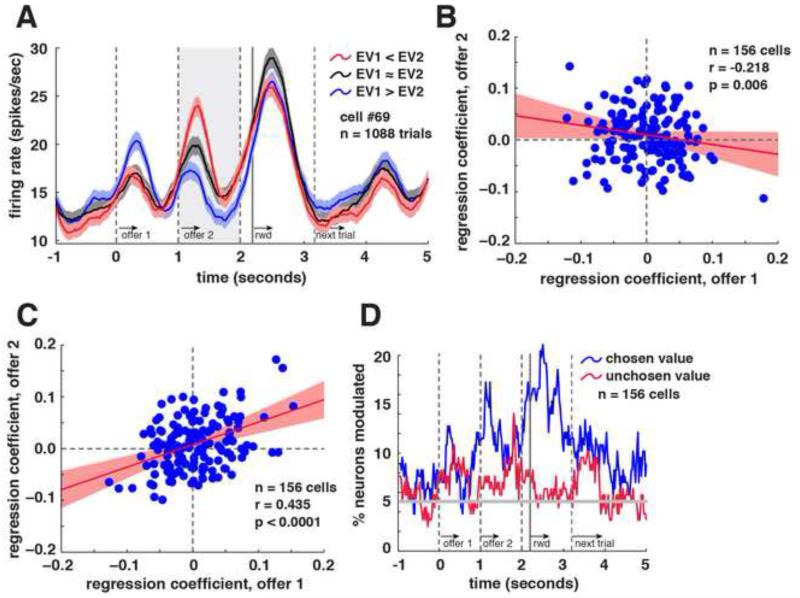
Figure 4.
vmPFC neuron activity related to comparison and choice. A. Average responses of example neuron (+/− 1 SE in firing rate), separated by binned expected value difference between offer values (offer value 1 minus offer value 2). During epoch 2, this neuron showed higher firing rates when offer value 2 was greater than offer value 1 (red), and lower firing when offer value 1 was greater than offer value 2 (blue). B. Scatter plot of coefficients for tuning for offer value 1 during epoch 2 (x-axis) and for offer value 2 during epoch 2 (y-axis). Least-squares regression line and confidence intervals are shown in red. C. Scatter plot of coefficients for tuning for offer value 1 during epoch 1 (x-axis) and for offer value 2 during epoch 2 (y-axis). Least-squares regression line and confidence intervals are shown in red. D. Plot of proportion of neurons that show a significant correlation between neural activity and the value of the chosen (blue) and unchosen (red) offers (500 ms sliding boxcar).

