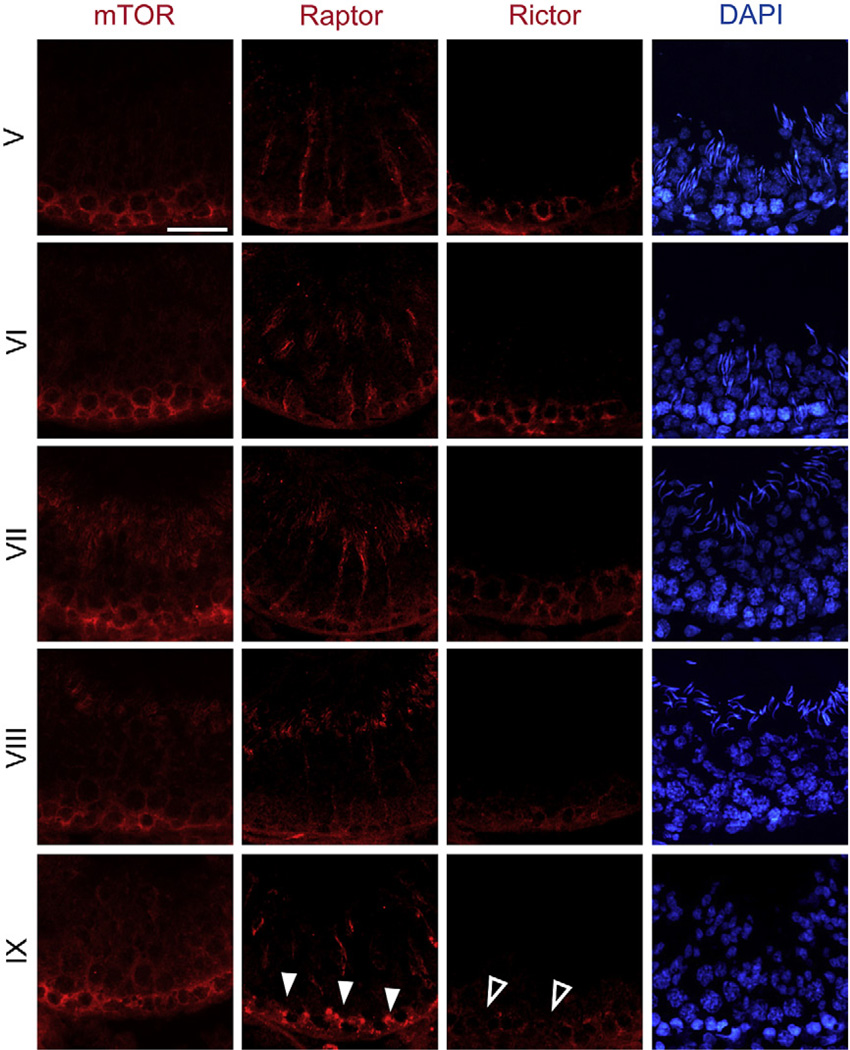
Figure 6.4. Stage-specific expression of raptor and rictor versus mTOR in the seminiferous epithelium of adult rat testes.
Relative expression level and localization of mTOR, raptor and rictor (red) in the seminiferous epithelium from stage V–IX tubules were examined by immunofluorescence microscopy. Cell nuclei were stained with DAPI (blue) to show the stages of the tubules. This figure shows that from stage V to IX, mTOR was expressed at relatively similar level at the basal compartment where BTB was located. On the other hand, the expression of raptor, which is the key binding partner of mTORC1, was transiently induced at stage IX (indicated by white arrow head) that begin in late stage VIII, most notably at the BTB, whereas the expression of rictor, which is the key subunit of mTORC2, was found to decline gradually from stage VII and became barely detectable at late stage VIII through stage IX (indicated by open arrow head), even though it remained weakly expressed in these stages. Bar, 50 μm, which applies to all micrograph. For interpretation of the references to color in this figure legend, the reader is referred to the online version of this book.

