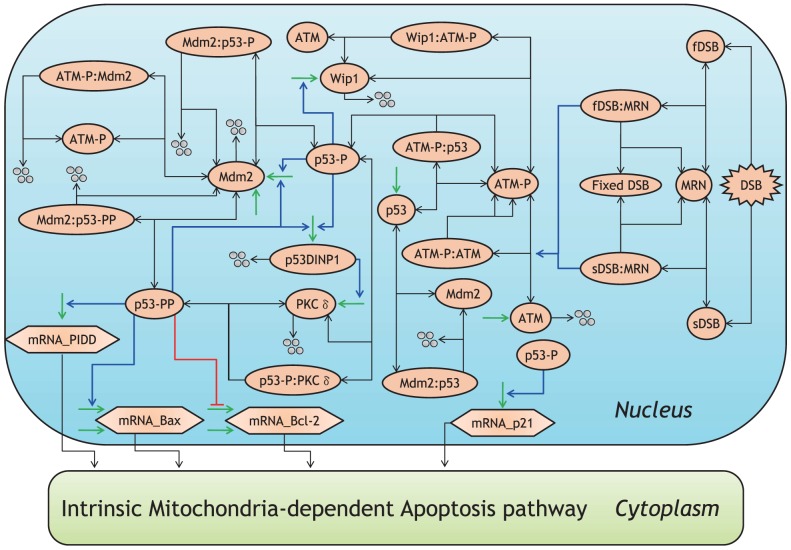
Figure 2. Molecular details of the DSB repair system and p53 signaling network in the nucleus.
Activation is represented by blue lines, suppression by red, synthesis by green, degradation by four circles, and binding by black lines. The abbreviations for each molecular species are described in Table S2.

