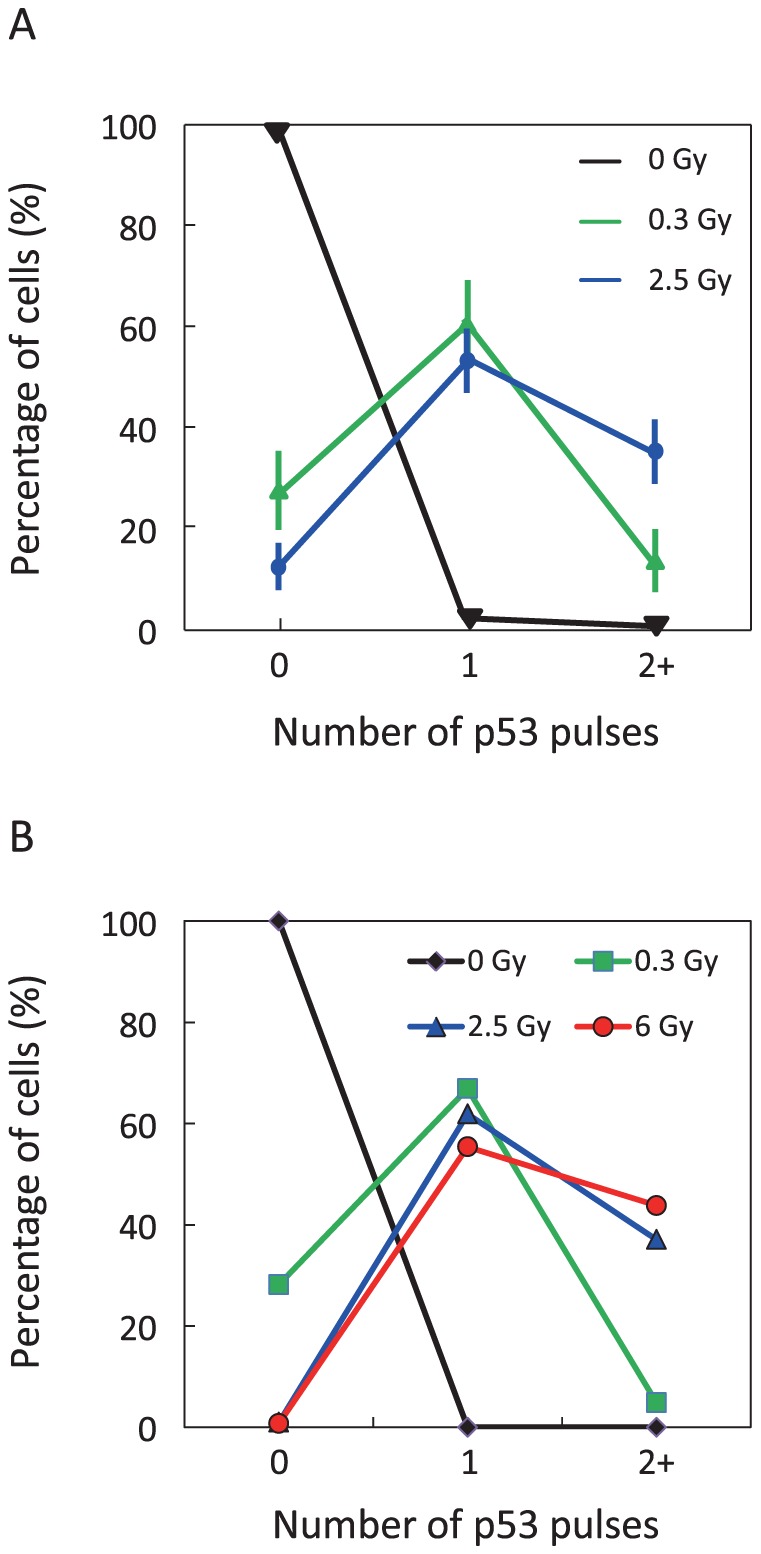
Figure 5. Statistical analysis of p53 pulses.

(A) The fraction of cells with zero, one, or two or more p53 pulses as a function of the IR dose is extracted from biological data reported by Lahav et al. [7]. Data are presented as mean ± SEM (B) The fraction of cells with zero, one, or two or more p53 pulses in populations of 1000 cells is calculated from results simulated using different IR doses.
