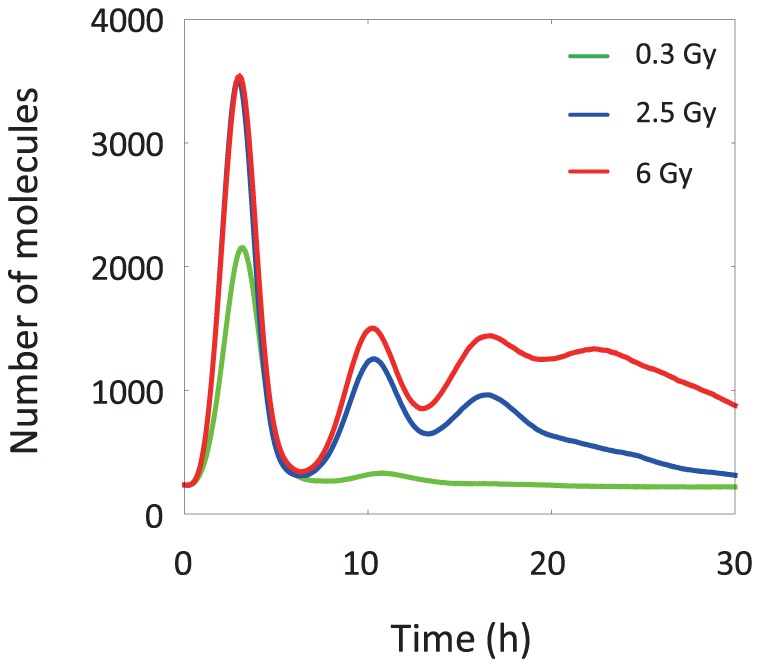
Figure 6. The time courses of total p53 for populations of 1000 cells.

Cells are subjected to an IR dose of 0.3, 2.5, or 6 Gy. Total p53 represents the summation of complexes including nuclear p53. p53 oscillations are damped at each IR dose.

Cells are subjected to an IR dose of 0.3, 2.5, or 6 Gy. Total p53 represents the summation of complexes including nuclear p53. p53 oscillations are damped at each IR dose.