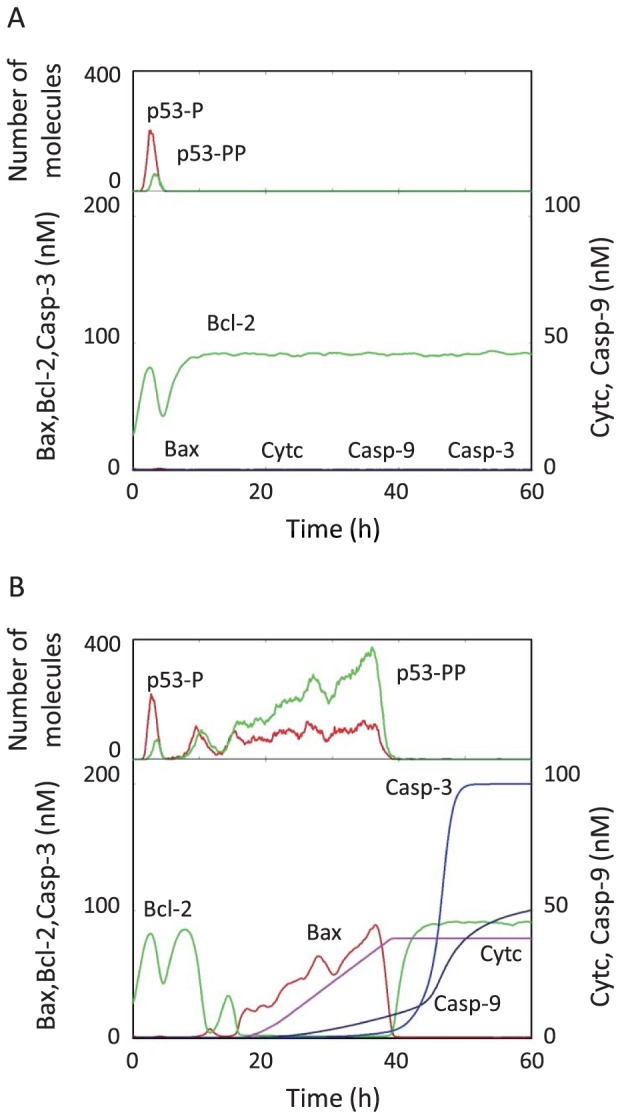
Figure 7. Simulated results of cytoplasmic species following an IR dose of 2.5 Gy at 0 h.

The time courses of Bax, Bcl-2, Cytc, Casp-9, Casp-3, p53-P, and p53-PP for two individual cells are shown. Each species represents the summation of complexes including the species. (A) Generation of one p53 pulse did not result in the activation of Casp-3. (B) Generation of multiple p53 pulses resulted in Casp-3 activation.
