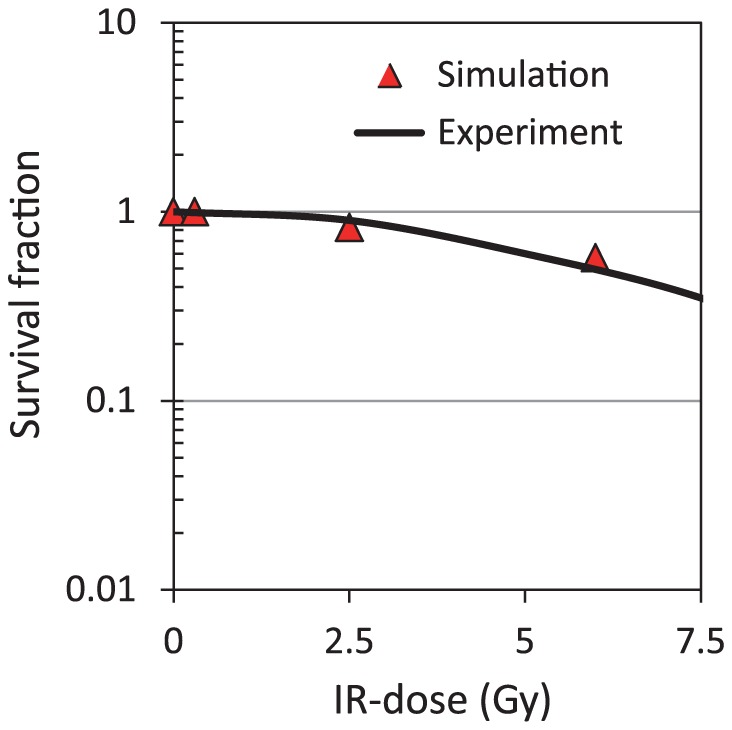
Figure 8. The surviving fraction (SF) of cells in the simulations and experiment data.

Simulation (triangle) represented the SF of a population of 1000 cells at IR doses of 0, 0.3, 2.5, and 6 Gy. Experiment (line) indicates the SF of experimental data as observed by Pellegata et al. [4].
