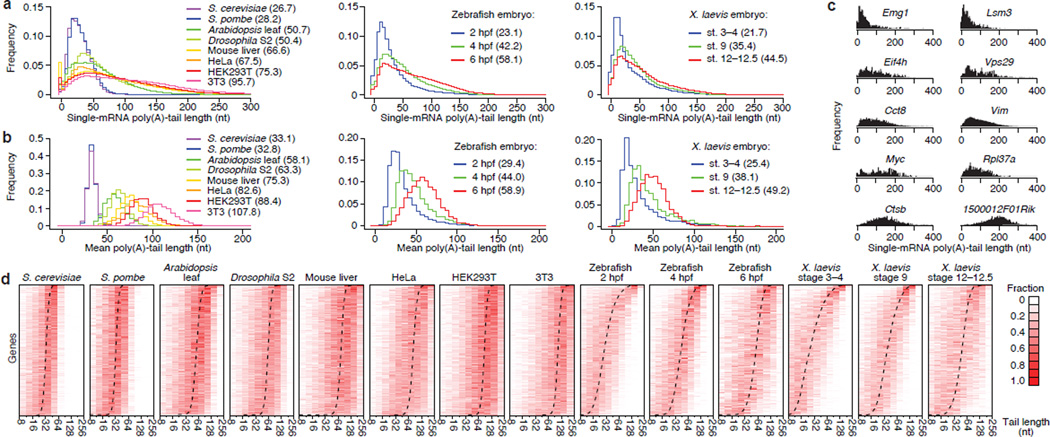
Figure 2. Poly(A)-tail lengths in yeast, plant, fly and vertebrate cells.
a, Global tail-length distributions. For each sample, histograms tally tail-length measurements for all poly(A) tags mapping to annotated 3′ UTRs (bin size = 5 nt). Leftmost bin includes all measurements <0 nt. Median tail lengths are in parentheses. b, Intergenic tail-length distributions. For each sample, histograms tally average tail lengths for protein-coding genes with ≥50 tags (yeasts, zebrafish and Xenopus) or ≥100 tags (other samples). Median average tail lengths are in parentheses. c, Intragenic tail-length distributions for 10 genes sampling the spectrum of average tail lengths in 3T3 cells. d, Intragenic tail-length distributions. Heatmaps show the frequency distribution of tail lengths for each gene tallied in b. The color intensity indicates the fraction of the total for the gene. Genes are ordered by average tail length (dashed line). Results from the S. cerevisiae total-RNA sample are reported in this figure.

