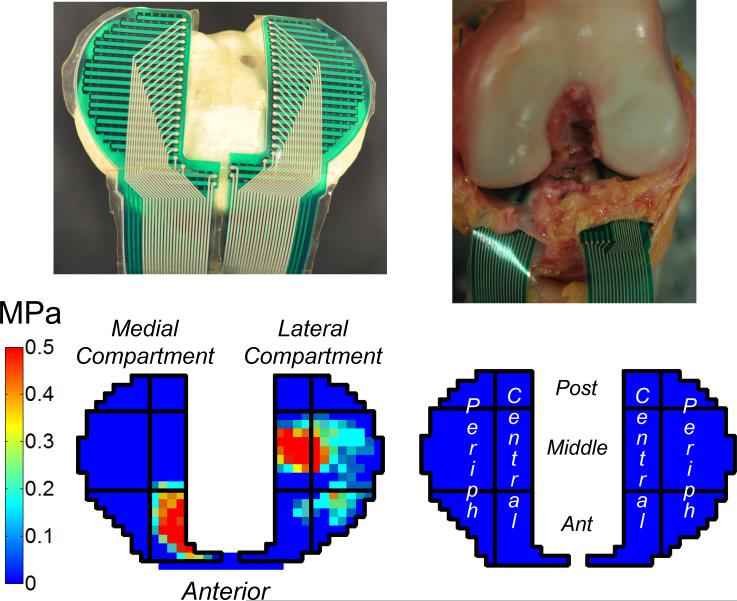
Figure 3.
Contact stress generated on the tibial plateau was measured using a stress-transducer (top left). It was slid underneath the menisci and sutured in place on the tibial plateau (top right). Representative two-dimensional plot of contact stress on the tibial plateau (bottom left). Each compartment was divided into six sectors (bottom right), containing central and peripheral columns (Periph=Peripheral) and anterior, middle and posterior rows (Post=Posterior, Ant=Anterior). Mean contact stress was calculated in each sector at the position of the knee corresponding to the maximum applied load.

