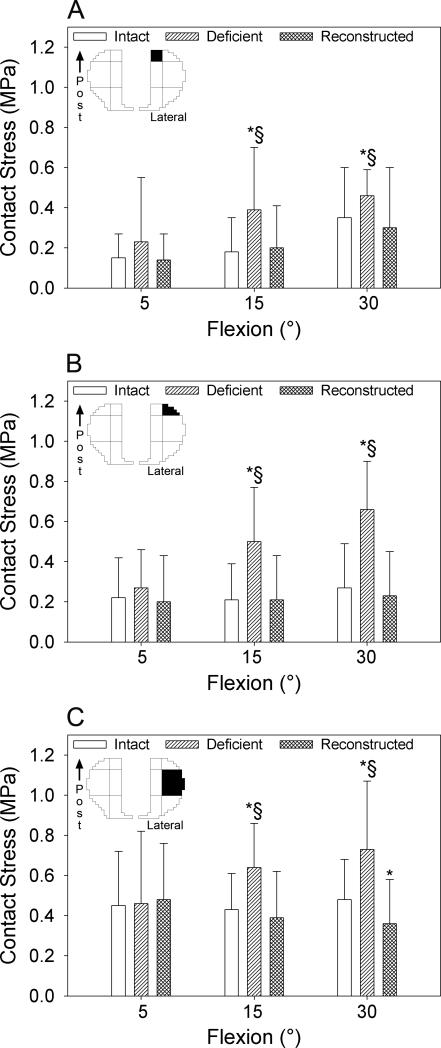
Figure 4.
Mean contact stress generated in the posterior central (A), posterior peripheral (B), and middle peripheral (C) sectors of the lateral compartment of the tibial plateau in response to combined abduction and internal rotation moments applied at 5, 15 and 30° flexion with the ACL intact (white), deficient (diagonal lines) and reconstructed (crosshatched lines). Whiskers indicate one standard deviation. The top left image in each graph identifies the sector (filled in black) of the contact stress map that the data refers to. Post=posterior; *p<0.05 compared with the intact knee; §p<0.05 compared with the ACL-reconstructed knee.

