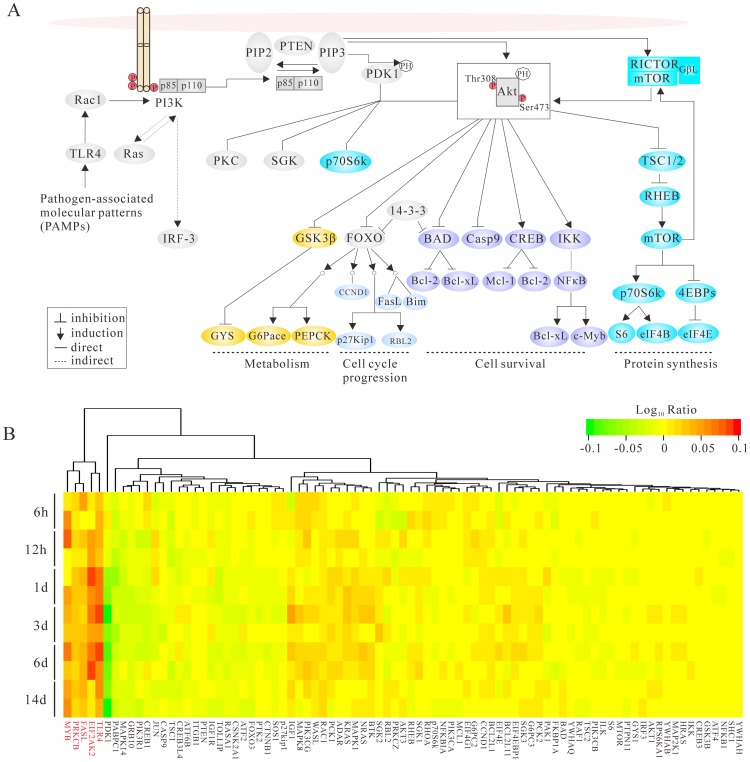
Figure 4. PI3K/Akt signaling and differential gene expression analysis.
(A) Schematic diagram for the regulation of PI3K-Akt signaling pathway. (B) Overview of temporal differential gene expression in rhesus macaques infected with A/Anhui/2/2005 (H5N1) at different time points. A color scale indicating expression levels for the heat map is shown at the top right. Genes exhibited up-regulated expression pattern over time are highlighted in red.

