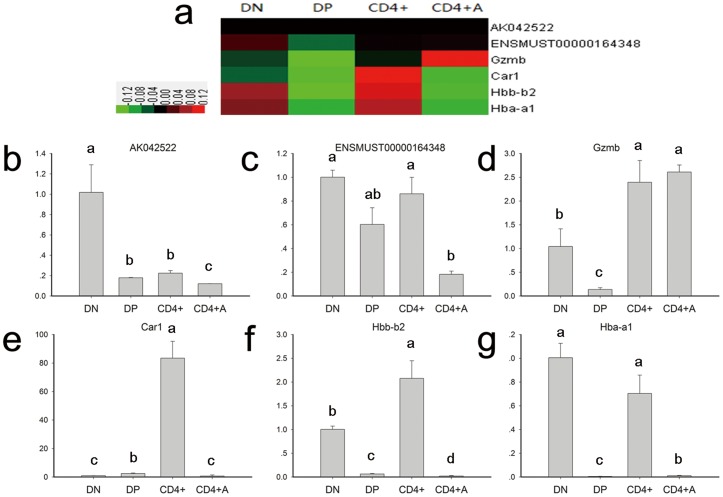
Figure 2. The expression profiles of two LncRNAs and four mRNAs in the T cell development and activation process.
(a) A heatmap of two LncRNAs and four mRNAs in the T cell development and activation process. (b–g) The expression patterns of two LncRNAs and four mRNAs in 4 cell lines as monitored by RT-qPCR. Unlike letters associated with bars on the histogram indicate a significant difference, (P<0.05).

