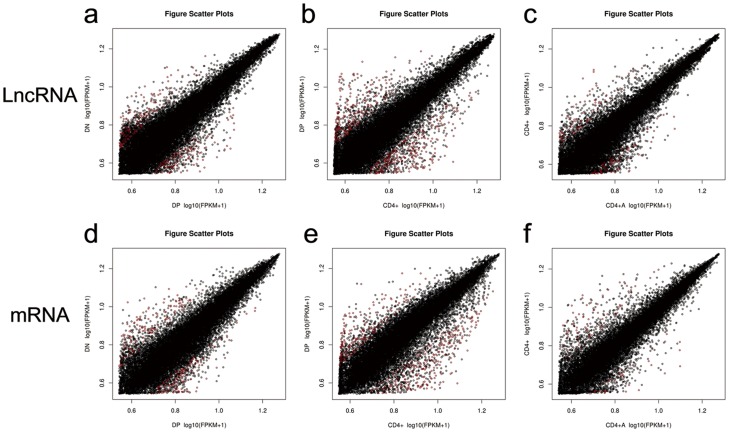
Figure 3. A log-log scatterplot comparing the global mRNA and LncRNA expression profiles between four subsets of CD4+ T cells.
(a,d) A log-log scatter plot between DN and DP, (b,e) a log-log scatter plot between DP and CD4+, and (c,f) a log-log scatter plot between CD4+ and CD4+A. Red dots indicate significant differences and the black dots indicate no significant differences.

