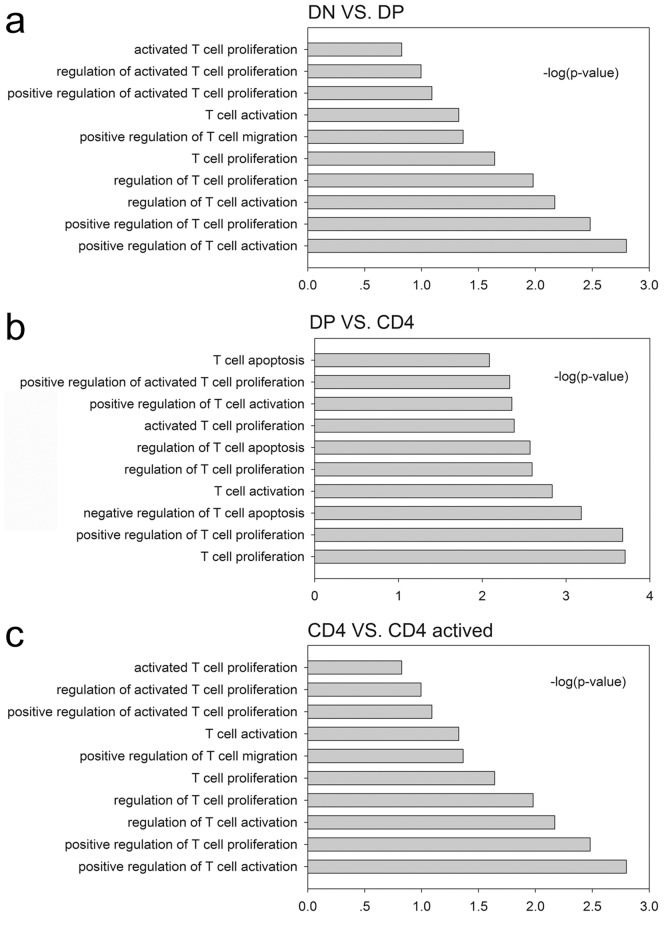
Figure 6. Results of the GO analysis of the genes with sequences matching LncRNAs. –log10(P) indicates the GO score related to the genes with a biological process P value.
(a) T cell function related biological processes of the LncRNA sequence matched genes in the DP VS. DN group; (b) T cell function related biological processes of the LncRNA sequence matched genes in the CD4+ VS. DP group; (c) T cell function related biological processes of the LncRNA sequence matched genes in the CD4+A VS. CD4+ group.

