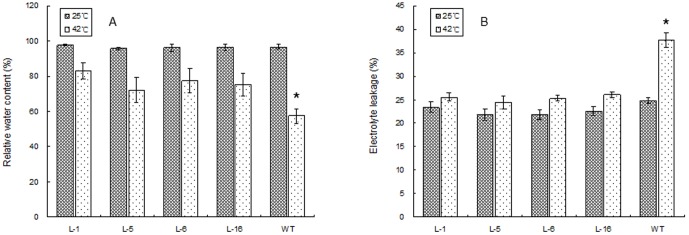
Figure 8. Leaf relative water content (A) and electrolyte leakage (B) in WT and four lines of transgenic tobacco under normal temperature and at 6 d of heat treatment.

WT represents the wild type tobacco. L1, L5, L6, and L16 are different transgenic tobacco lines. The vertical bar over each column represents standard error of the mean for three replicates in each treatment. The “*” over the column of the WT indicates significant difference of the WT from all transgenic lines under heat stress based on least significance difference test at p = 0.05. Columns without “*” indicate no differences among the WT and transgenic lines.
