
Figure 4. ROC curve analyses of combined test of TTF-1 and Napsin A in distinction between AC from SQCC.
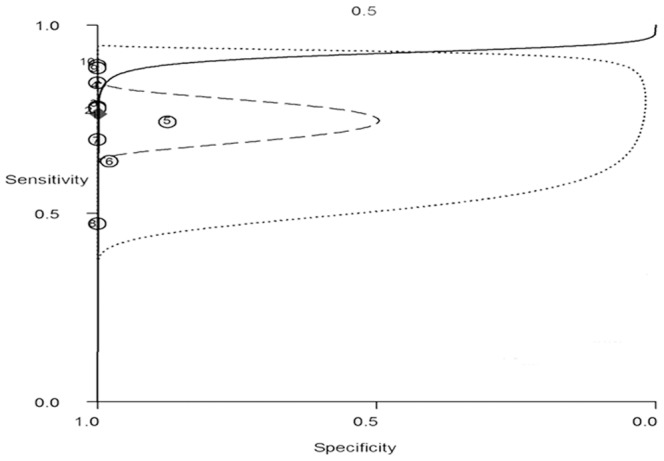
ACU = 0.92[0.89–0.94], sensitivity = 0.76[0.69–0.83], specificity = 1.00[0.92–1.00]. Solid line presents sROC; circle presents observed data; diamond presents summary operating point; dash line presents 95% confidence contour; points dotted line presents 95% prediction contour.