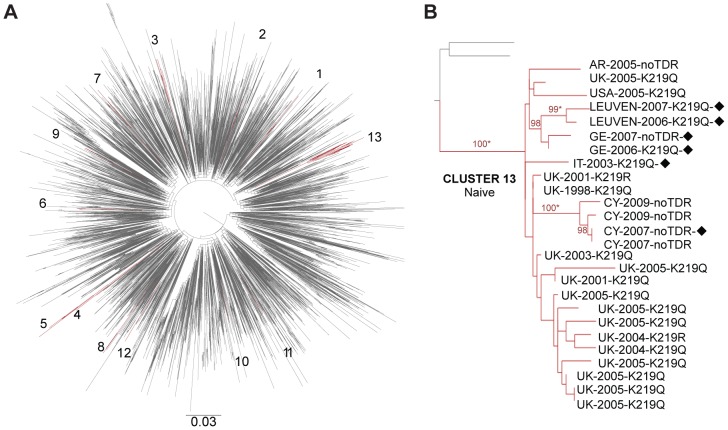
Figure 2. Examples of subtype B transmission clusters (TCs) with TDR: A maximum likelihood (ML) tree per subtype was constructed, and TCs were confirmed by Bayesian Phylogenetic analyses.
(A) The ML tree for subtype B (Leuven ND cohort and control sequences) with the TCs colored in dark red. (B) The largest TC of subtype B: composed of therapy-naive patients, several nationalities and mutations at RT position 219; bootstrap values above 98% are shown. Abbreviations: AR: Argentina, CY: Cyprus, GE: Germany, IT: Italy, UK: United Kingdom, USA: United States of America, black diamond: men who have sex with men, asterisk: posterior distribution equal to 1 in the Bayesian phylogenetic analysis.

