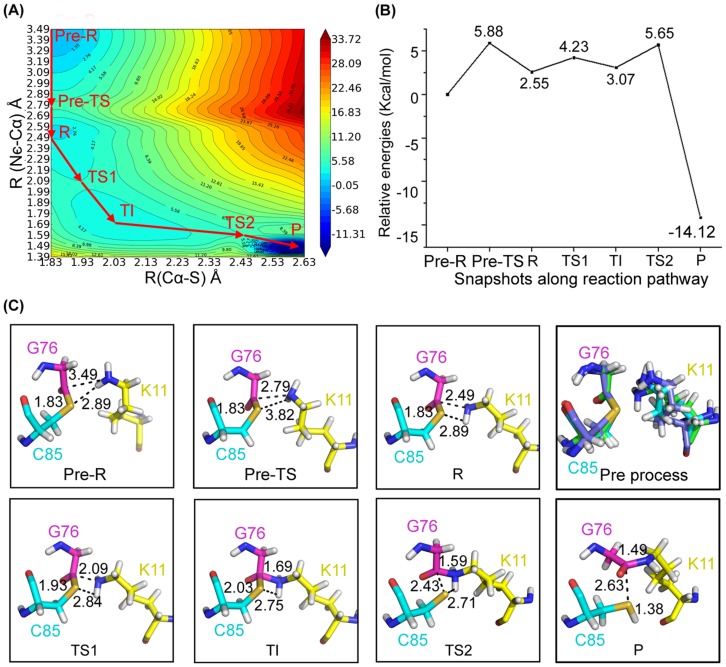
Figure 2. Overview of the nucleophilic attack.
(A) The potential energy surface of nucleophilic attack along defined reaction coordinates. (B) The relative energy of representative conformations along the reaction pathway. (C) The QM/MM optimized structures of the reactant (R), transition states (TSs), transition immediate (TIs), and product (P).

