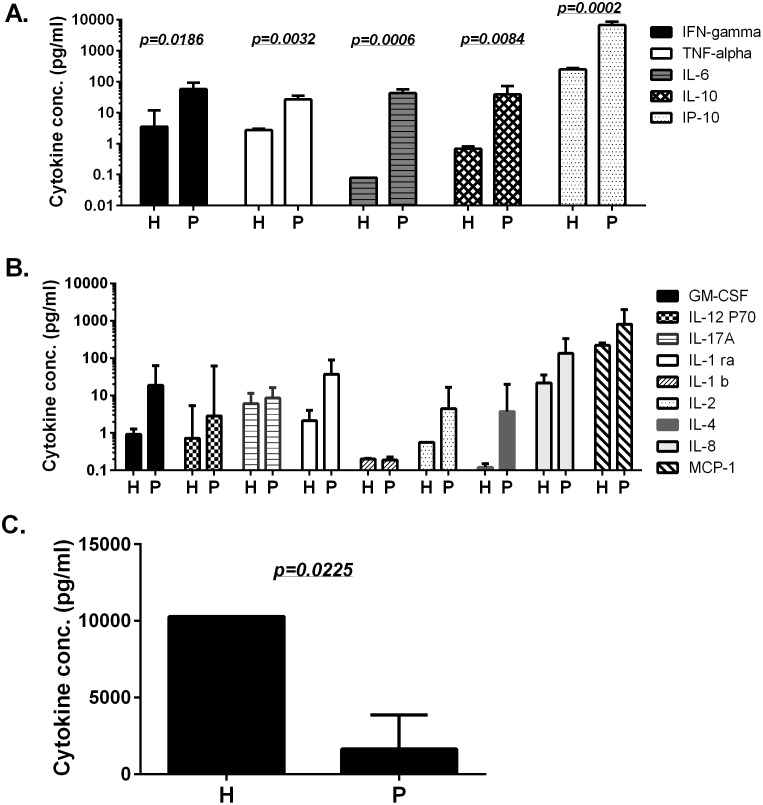
Figure 2. The peak serum cytokine and chemokine levels in H7N9 patients and healthy donors.
“P” or “H” under each column indicates “H7N9 patients” or “healthy donors”, respectively. Three patterns of cytokine/chemokine profiles are shown: significantly elevated (A), elevated but not significant (B) or significantly suppressed (C) in H7N9-infected patients when compared to healthy donors. Each bar represents the geometric mean of each serum cytokine/chemokine concentration with standard error of in six patients or eight healthy donors. Statistical significance is indicated when the p value is less than −0.05between the patient and healthy donor groups.

