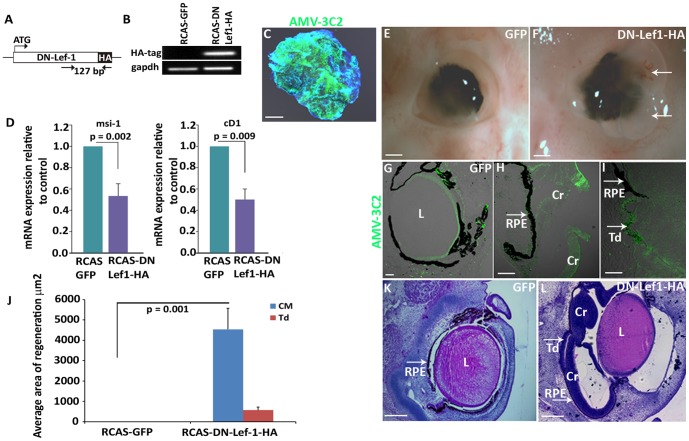
Figure 8. Inhibiting β-catenin/LEF/TCF transcriptional activity is sufficient to induce chick retina regeneration.
(A) Schematic of a dominant negative lef1 gene that was cloned into an RCAS vector. (B) RT-PCR confirms the RCAS DN-Lef1-HA construct is successfully expressing the HA tag in electroporated CM explants from E4 eyes. The amplified 127 bp region is shown in (A). (C) AMV-3C2 immunohistochemistry shows the presence of viral protein in RCAS DN-Lef1-HA electroporated CM explants after 48 hours. (D) RT-qPCR data shows the level of β-catenin/Lef1/TCF target genes Musashi-1 (msi1) and cyclin D1 (cD1) in RCAS DN-Lef1-HA electroporated CM explants compared to the RCAS GFP electroporated controls (p values shown represent significance). (E–F) Whole eye images show the amount of regeneration in the presence of RCAS GFP (E) and RCAS DN-Lef1-HA (F) at 3 d PR; arrows indicate the regenerating neuroepithelium growing out of the eye, which happens in some cases during regeneration. (G–I) AMV-3C2 immunohistochemistry shows the presence of viral proteins in RCAS GFP infected eyes (G) and in the regenerating neuroepithelium from the CM (H) and RPE transdifferentiation (I) in RCAS DN-Lef1-HA infected eyes. (J) Quantitative analysis shows the difference in amount of regeneration observed in histological sections of RCAS DN-Lef1-HA infected eyes and RCAS GFP infected eyes (p values shown represent significance). (K–L) Histological sections of RCAS GFP and RCAS DN-Lef1-HA infected eyes at 3 d PR. Cr = ciliary regeneration; Td = transdifferentiation; L = lens; RPE: retina pigmented epithelium. Scale bars in (C), (K) and (L) represent 200 µm; Scale bars in (E) and (F) represent 1 mm; Scale bar in (G, H and I) represents 100 µm. Error bars in (D) and (J) represent S.E.M.

