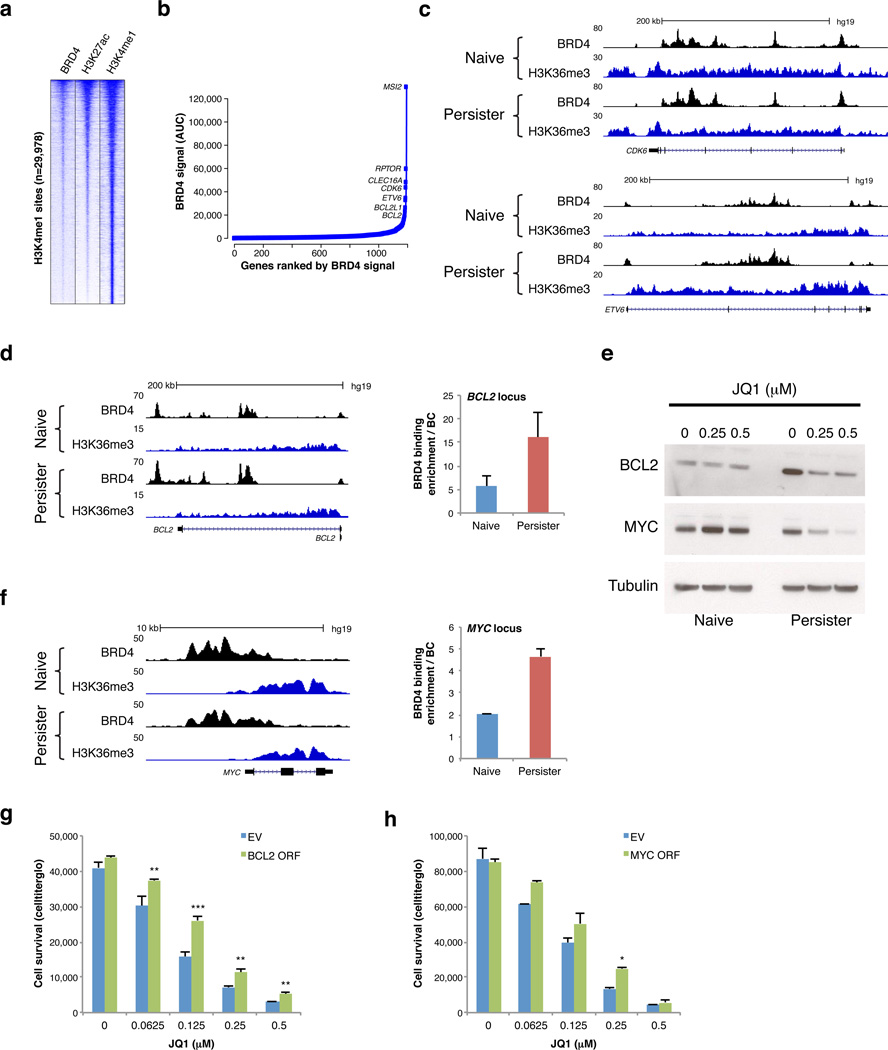
Figure 3. BRD4 binds enhancers near developmental, cell cycle and pro-survival genes in T-ALL.
a. Heatmap shows enrichment signals for BRD4, H3K27ac and H3K4me1 over 29,978 H3K4me1-marked distal sites in persister cells (rows; 10 kb regions, centered on H3K4me1 peaks, ranked by overall signal intensities of BRD4 and H3K27ac). b. BRD4 peaks were ranked by signal intensity of area under the curve (AUC) in persister cells averaging BRD4 signal intensities of DND-41 and KOPT-K1 persisters to identify candidate ‘super-enhancers’. Plot depicts top ranked sites linked to an active gene in T-ALL (see Methods). c. Tracks show BRD4 binding and H3K36me3 enrichment (marks transcribed regions) over the CDK6 and ETV6 loci, both of which contain BRD4-bound ‘super-enhancers’. d, f. Tracks show BRD4 binding and H3K36me3 enrichment across the BCL2 and MYC loci in naïve and persister cells (left). Plots (middle) show BRD4 enrichment as measured by ChIP-qPCR over putative regulatory elements in the BCL2 and MYC loci in naïve and persister cells (2 replicates, error bars reflect s.d.). e. Western blots show BCL2 and MYC expression in naïve and persister cells after 4 days treatment with indicated JQ1 doses. (Data shown for KOPT-K1 cells; Data for DND-41 in Figure S5). g. Plot shows relative proliferation of DND-41 persister cells transfected with BCL2 expression vector (BLC2 ORF) or empty vector control (EV) after 6 days treatment with indicated JQ1 doses (3 replicates, error bars reflect s.d., ** = p value < 0.01, *** = p value < 0.001). h. Plot shows relative proliferation of DND-41 persister cells transfected with MYC expression vector (MYC ORF) or empty vector control (EV) after 6 days treatment with indicated JQ1 doses (2 replicates, error bars reflect s.d., * = p value < 0.05).

