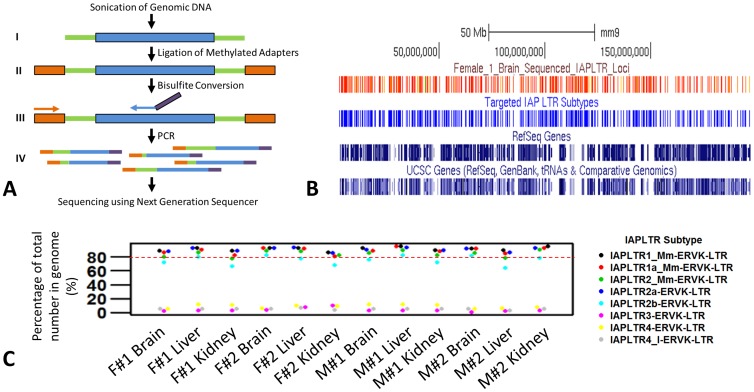
Figure 1. Scheme and efficiency of the High-Throughput Repeat Element Bisulfite Sequencing (HT-TREBS) technique using mouse IAP LTR elements.
(A) Schematic of the HT-TREBS depicting the steps involved up to the run in a next-generation sequencer. The blue bars and the green bars in steps I-IV represent the IAP LTR sequences and the adjoining unique sequences respectively. The orange bars in steps II–IV represent the methylated Ion Torrent ‘A’ adaptor. The orange arrow in step III depicts the forward primer corresponding to the ‘A’ adaptor region while the blue arrow depicts the reverse primer corresponding to the chosen IAP LTR site. The reverse primer also has the Ion Torrent ‘P1’ adaptor sequence attached to it as depicted by the purple bar. Step IV shows that the PCR products generated from a single specific IAP LTR locus might have varying lengths because of the random lengths of the unique sequences (green bars) caused by sonication. (B) Efficiency of the HT-TREBS. The distribution of the sequenced IAP LTR loci (depicted in red) in chromosome 1 (mm9) of the Female #1 brain sample. The IAP LTR elements have been sequenced without any chromosome region bias. A comparison with the positions of the five targeted subtypes (depicted in blue) shows that the majority of the targeted loci have been sequenced. (C) Specificity of the HT-TREBS. Graph showing the percentage of the total number of different IAP LTR subtypes that have been sequenced in the all twelve samples. The dashed red line shows the level of 80%. The percentages of the total number of the five targeted IAP LTR subtypes (IAPLTR1, IAPLTR1a, IAPLTR2, IAPLTR2a, and IAPLTR2b) that have been sequenced are more than 80% in majority of the cases. The three non-targeted IAP LTR subtypes (IAPLTR3, IAPLTR4, and IAPLTR4_I), even though sequenced, were actually represented by a much smaller fraction of their total number in the genome (less than 12% in all the cases).

