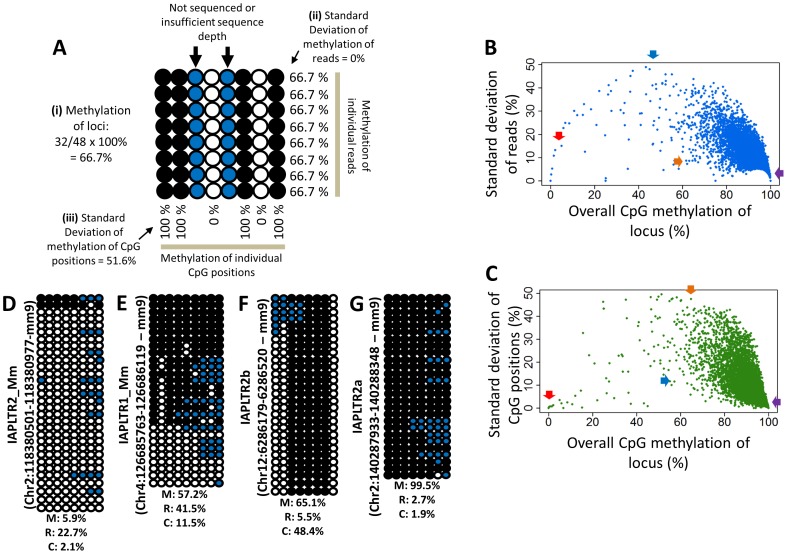
Figure 2. Depiction of the canonical methylation pattern of the IAP LTRs by ‘sprinkler plot’.
(A) A hypothetical IAP LTR locus showing the calculation of the i) the overall CpG methylation of the locus, ii) the standard deviation of methylation of individual reads, and iii) the standard deviation of methylation of individual CpG positions. The methylation values of any CpG sites in the flanking sequences (not shown here) have not been considered. The bubble chart depicts the methylation states of each CpG position. Each row represents a different read and each column represents a different CpG position. Filled and open circles indicate methylated and unmethylated cytosines, respectively, whereas the blue circles indicate CpG positions which did not have any or sufficient sequence information. The CpG positions are arranged in the 5′ to 3′ direction of the sequenced region while going from left to right in each read. (B) The ‘sprinkler plot’ for the Female #1 brain sample showing the relation of the overall CpG methylation percentage of each sequenced IAP LTR locus to the standard deviation of CpG methylation percentage of individual reads of that locus. Likewise, in (C) the relations of the overall CpG methylation percentages of the loci to their respective standard deviations of CpG methylation percentage of individual CpG positions (only the ones sequenced) is shown. In both the sprinkler plots, each dot represents a single IAP LTR locus. Four representative patterns of CpG methylations of the loci have been shown in bubble charts by taking sequencing data from the mentioned sample: (D) near-unmethylation, (E) read-driven hypomethylation, (F) CpG position-driven hypomethylation, and (G) near-methylation. The percentages at the bottom of each bubble chart shows their respective overall CpG methylation percentage (M), standard deviation of CpG methylation percentage of individual reads (R), and standard deviation of CpG methylation percentage of individual CpG positions (C). The approximate positions of these representative loci have been indicated in (A) and (B) by the red, blue, orange, and purple arrows for (D), (E), (F), and (G), respectively.

