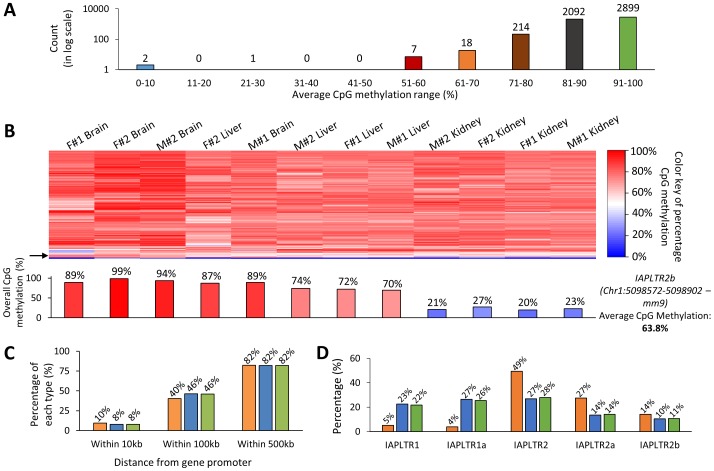
Figure 3. Analyses of the hypomethylated IAP LTRs.
(A) A breakdown of the IAP LTRs in the 5,233 representative set based on their average CpG methylation percentage in the twelve samples. The numbers on top of each bar indicates the count of loci in that category. Approximately 5% of the IAP LTR loci (242 loci) have less than 80% CpG methylation levels (hypomethylated). (B) Heatmap showing the difference in CpG methylation of the hypomethylated IAP LTR loci (less than 80% CpG methylation levels) among the 12 sequenced samples. The color key on the right depicts the colors representing each value of CpG methylation (blue: 0%, white: 50%, and red: 100%). The tissues in the heatmap have been ordered/clustered based on the differences in CpG methylation of the IAP LTR loci among the tissues (dendrogram not shown). The variation in the CpG methylation among the samples for one particular locus (IAPLTR2b at the position chr1: 5098572–5098902, mm9) is represented by the bar graph below the heatmap. The approximate position of this locus on the heatmap is shown by the black arrow on the left. The bar graph shows the CpG methylation for that locus varies from 20% to 99% among the samples even though the average CpG methylation of that locus is 63.8%. (C) The percentage of the hypomethylated (<80%) and mostly methylated (>80%) loci that are within 10, 100, and 500 kb of the promoters of known genes. The orange, blue, and green bars indicate hypomethylated, mostly methylated, and the combined loci (5,233 representative set), respectively. (D) Percentage representation of the different subtypes of IAP LTR among the hypomethylated, mostly methylated, and combined categories. Once again the colored bars represent the three categories as mentioned earlier.

