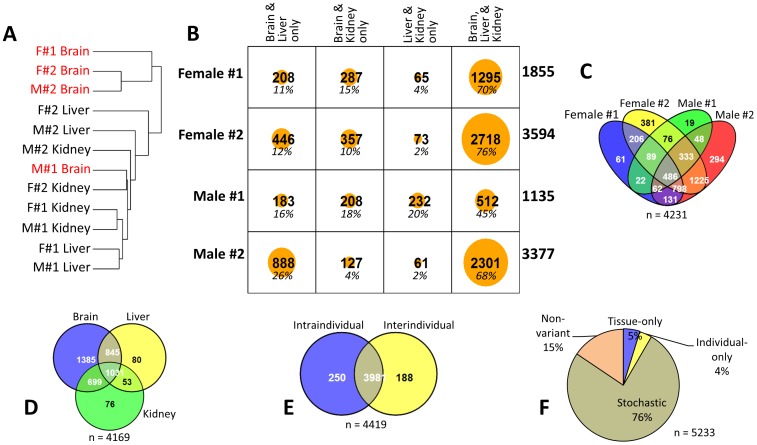
Figure 4. DNA methylation variations of the IAP LTR retrotransposons.
(A) Dendrogram showing the clustering of the 12 sequenced samples based on the differences in CpG methylation of the IAP LTR loci. The brain samples tend to show much different CpG methylation than the other samples. (B) Intra-individual variation (between tissues of the same individual) of CpG methylation. Matrix showing the numbers of IAP LTR loci that have been found to be statistically significantly different (Kruskal-Wallis test; p<0.001) in their CpG methylation percentages between brain, liver, and kidney in different combinations in the four individuals (Female#1-2, Male#1-2) that have been sequenced. The numbers on the far right of each row indicate the total number of IAP LTR loci that have been found to be varying in that particular individual while the percentages in italics in each cell indicate the number of loci in the respective cells as percentage to the total number of loci for that individual. (C) Four-way Venn diagram showing the number of overlapping and non-overlapping IAP LTR loci of the four individuals that have been found to be varying intra-individually. (D) Inter-individual variation (between individuals in the same tissue) of CpG methylation. Three-way Venn diagram showing the number of overlapping and non-overlapping IAP LTR loci of the three tissues that have been found to be varying inter-individually (Kruskal-Wallis test; p<0.001). Once again brain samples show more difference in their CpG methylation than the other tissues, since the brain has much higher number of IAP LTR whose CpG methylation varies exclusively in that tissue among the individuals. (E) Intersection between IAP LTR loci varying intra-individually and those varying inter-individually. (F) Number of loci of the four categories of CpG methylation variation as a percentage of the total number of loci in the representative IAP LTR set.

