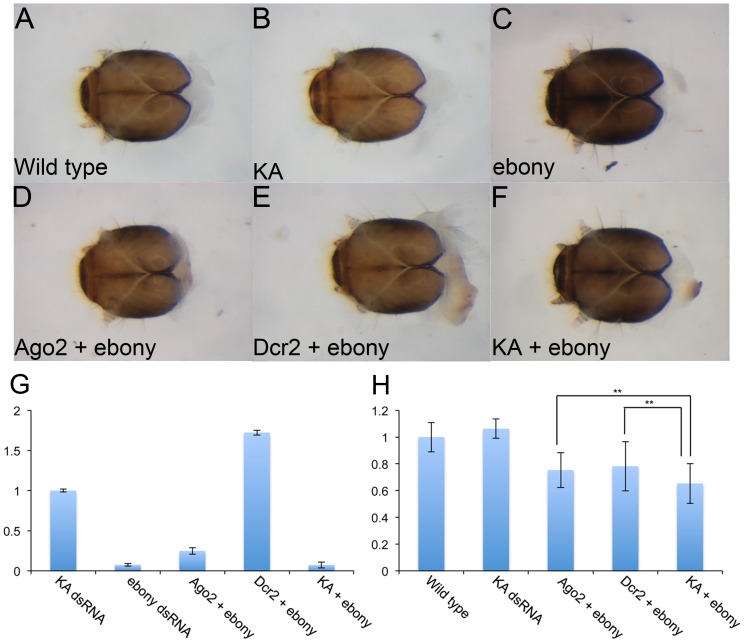
Figure 7. RNAi for Dcr2 and Ago2 efficiently suppress the marker gene RNAi.
(A–F) The head capsule of wild-type (A), KA dsRNA (B), ebony RNAi (C), Ago2 + ebony RNAi (D), Dcr2 + ebony RNAi (E), and KA + ebony RNAi (F). Both Ago2 and Dcr2 RNAi, but not KA dsRNA, suppress the ebony RNAi phenotype (D, E). (G) qPCR quantification of ebony mRNA. The Y-axis indicates relative expression levels compared to the control (KA dsRNA). (H) ImageJ analysis for the Ago2 and Dcr2 assay results. The Y-axis indicates the pigmentation index with 1 being the wild-type mean gray value. Both Ago2 + ebony RNAi and Dcr2 + ebony RNAi larvae have significantly higher pigmentation values than the KA + ebony RNAi control (P**≤0.01. n = 40 for KA and n = 20 for other experiments).

