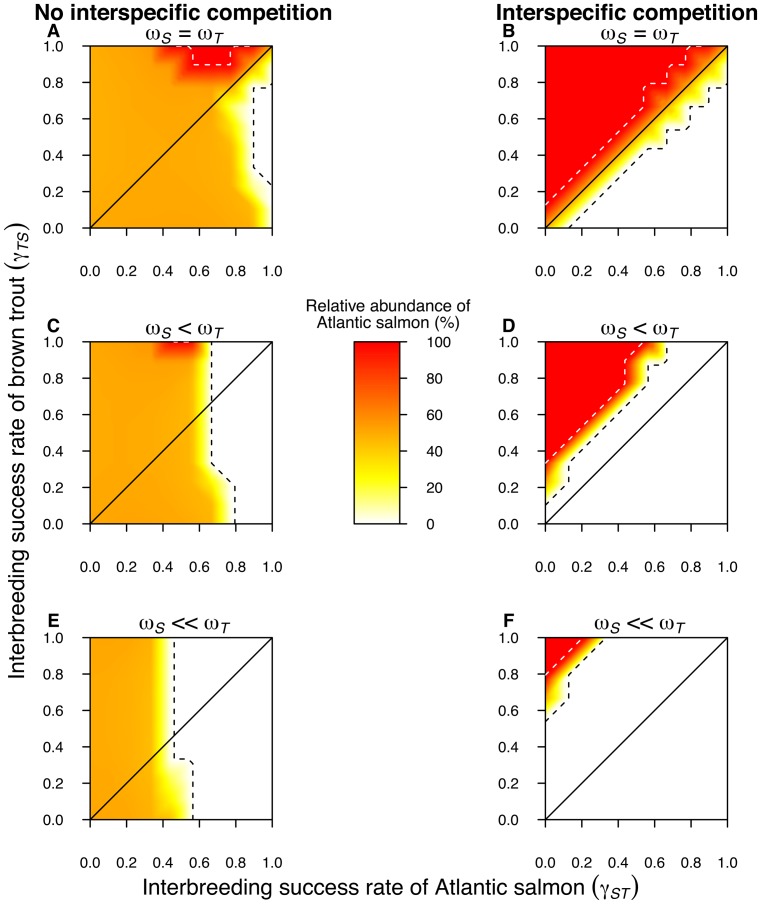
Figure 2. Relative abundance of Atlantic salmon (%) as compared to brown trout ( ).
).
The diagonal solid lines represent equal interbreeding success rates between Atlantic salmon ( ) and brown trout (
 ). Black or white dotted lines delimit the extinction area of Atlantic salmon and brown trout population, respectively. ωS = ωT indicates equal fitness for Atlantic salmon (ωS = 1) and brown trout. ωS<ωT indicates that Atlantic salmon has a 20% fitness reduction (ωS = 0.8). ωS<<ωT indicates that Atlantic salmon has a 40% fitness reduction (ωS = 0.6). In a), c), and e), Atlantic salmon and brown trout do not compete. In b), d), and f), Atlantic salmon and brown trout have density-dependent competition. The data presented correspond to the situation after 100 time steps (years).

