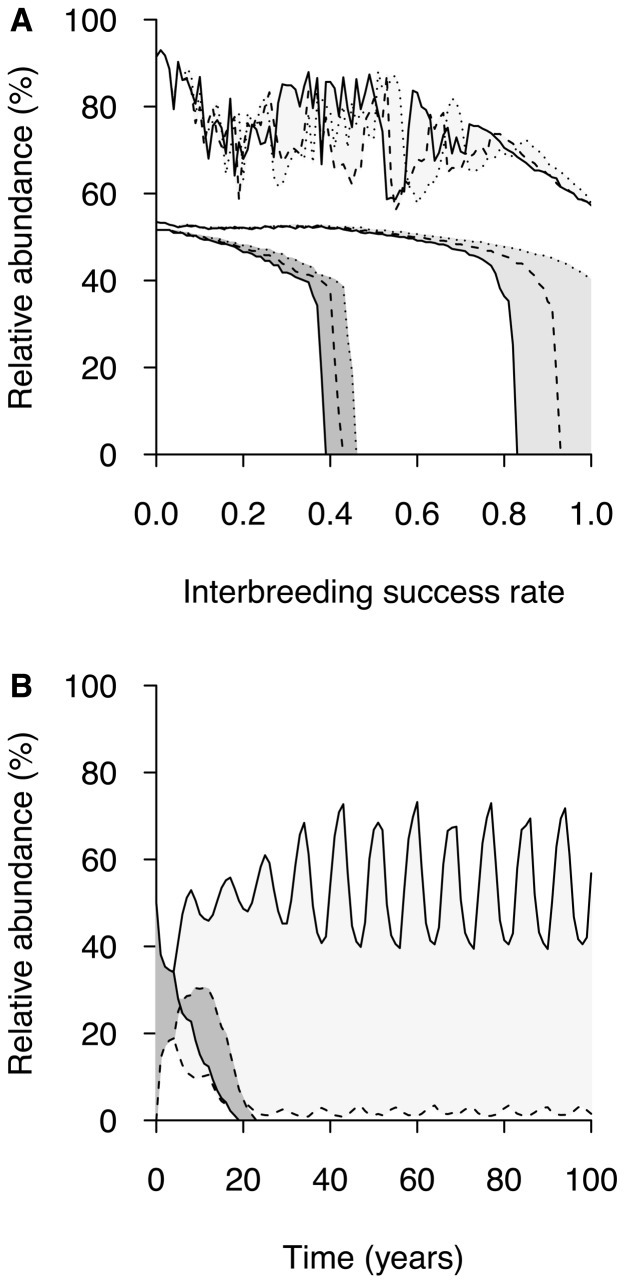
Figure 3. Relative abundance of a population of Atlantic salmon affected by a disease (ωS = 0.6).
The abundance is given in percent of the total number of salmonids ( ). Brown trout are resistant to disease (ωT = 1) and are not in competition with Atlantic salmon. (▪) R = 3; (▪) R = 6; (▪) R = 12. In a) effects of varying yet symmetric interbreeding success rate (
 ); the trout disease resistance is inherited with the following properties: (—) dominantly in hybrids (εT½ = 1 and ε½ ⅔ = 1); (…) recessively in hybrids (εT ½ = 0 and ε½ ⅔ = 1); and (– –) codominantly in hybrids (εT ½ = 0.5 and ε½ ⅔ = 0.5). In b) time series of the relative abundance of Atlantic salmon (—) and hybrid populations (…) ((N½+N⅔)/(N0+N1+N½+N⅔)). The data presented correspond to the situation after 100 time steps (years).

