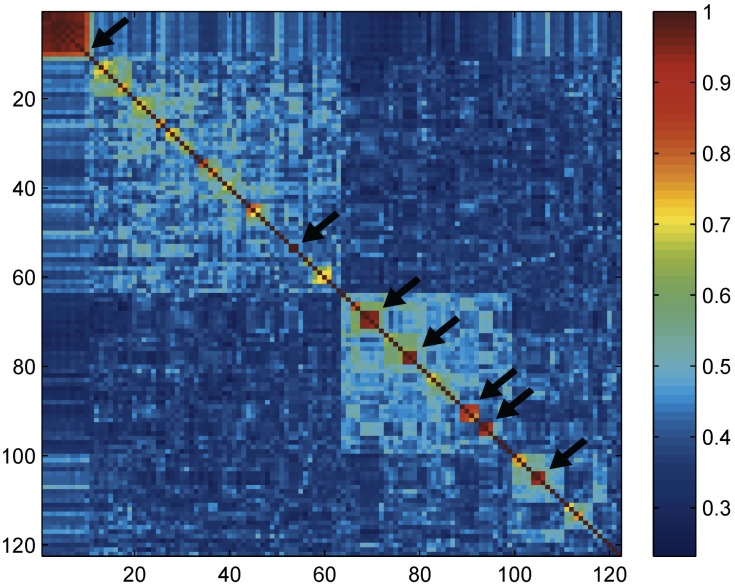
Figure 3. Terebridae Klee diagram.
Klee diagram for the COI gene showing the correlation amongst indicator vectors for the less inclusive (splitter) dataset obtained with the ABGD method and including 125 PSHs. Color gradation in red indicates high correlation values. Arrows indicate the conflicting PSHs between the more inclusive and the less inclusive partitions discussed in the text and listed in Table S1.

