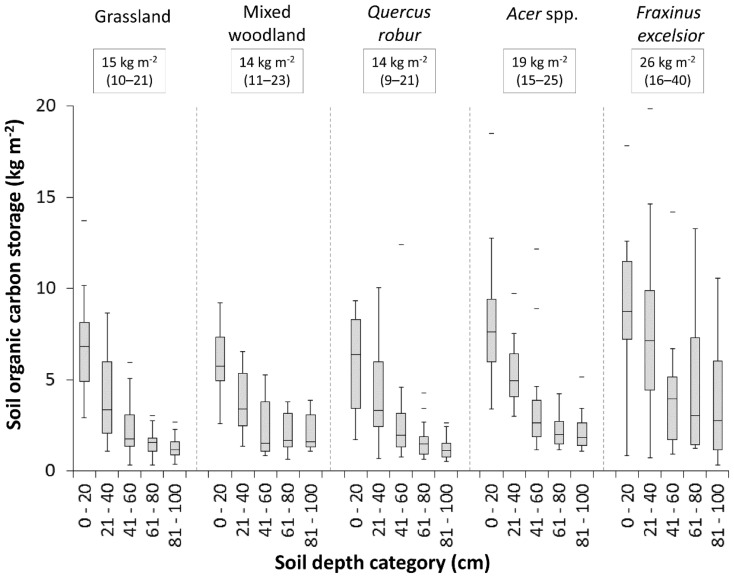
Figure 1. Soil organic carbon storage within each 20(summed median values are displayed in text boxes, values in parenthesis are total 25th and 75th percentiles), beneath Quercus robur (n = 12), Fraxinus excelsior (n = 11), Acer spp. (n = 12), mixed woodland (n = 8) and grassland (n = 15) by depth class.
The horizontal line within the box indicates median, box boundaries indicate 25th and 75th percentiles, whiskers indicate highest and lowest values, horizontal lines above or below whiskers indicate outliers.

