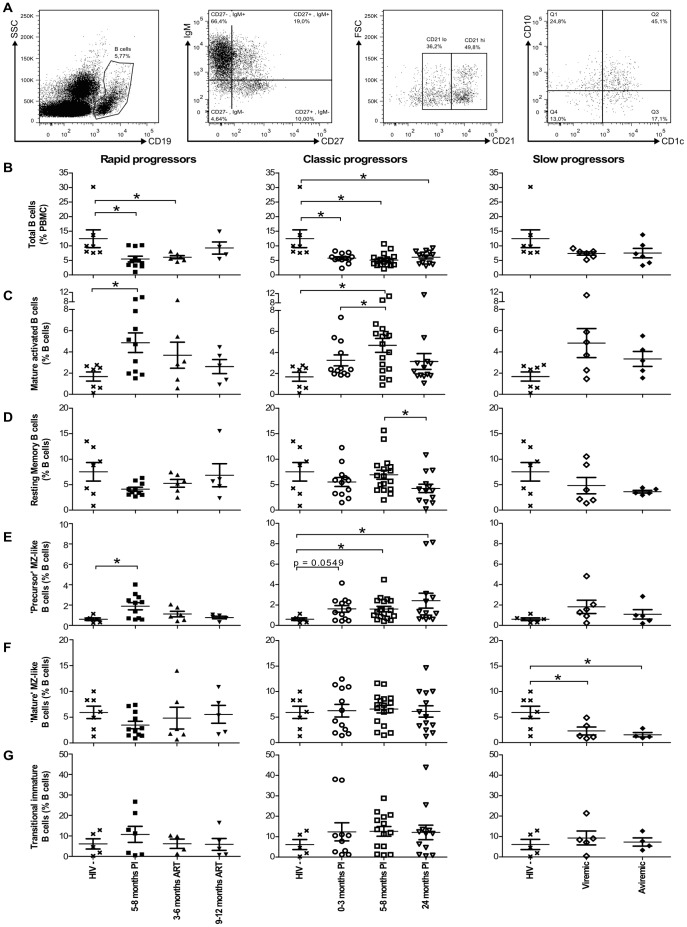
Figure 1. Longitudinal analysis of blood B-cell populations of HIV-1 infected individuals.
(A) Representative plot showing gating strategy on live PBMCs. Total CD19+ B-cells were selected based on expression of CD27 and/or IgM, and levels of CD21. CD1c and CD10 expression were used for further characterisation of blood MZ and TI B-cell populations respectively, as reported [13]. Quadrants were set based on the expression values obtained with fluorescence minus one (FMO) and isotype controls. Mature activated B-cells are defined as CD19+CD27+IgM-CD21loCD1c-CD10-, resting switched memory B-cells are CD19+CD27+IgM-CD21hiCD10-, precursor marginal-zone (MZ)-like B-cells are CD19+CD27+IgM+CD21loCD1c+ CD10+, mature MZ-like B-cells are CD19+CD27+IgM+CD21hiCD1c+CD10- and transitional immature (TI) B-cells are CD19+CD27-IgM+CD21hiCD1c-CD10+. The graphs present (B) percentages of total B-cells (mean events gated: 9320±1750), and the relative frequencies of (C) mature activated (mean events gated: 360±67), (D) resting switched memory (mean events gated: 632±301), (E) precursor MZ-like (mean events gated: 145±36), (F) mature MZ-like (mean events gated: 327±233) and (G) TI (mean events gated: 944±174) B-cell populations in the blood of rapid progressors (left panels; 5–8 months PI (n = 11), 3–6 months ART (n = 6) and 9–12 months ART (n = 5)), classic progressors (middle panels; 0–3 months PI (n = 12), 5–8 months PI (n = 17), and 24 months PI (n = 13)), and viremic and aviremic slow progressors (EC) (right panels; viremic (n = 6); aviremic (n = 5)). The same values for HIV-negative donors in the left, middle and right panels are used as a control group (n = 7). Cell population frequencies were compared using the Wilcoxon signed rank test and the Mann-Whitney U test for pairwise comparisons of different phases of infection within each group and between the study groups, respectively. Data shown are mean ±SEM. * p<0.05. PI, post-infection; ART, antiretroviral therapy.

