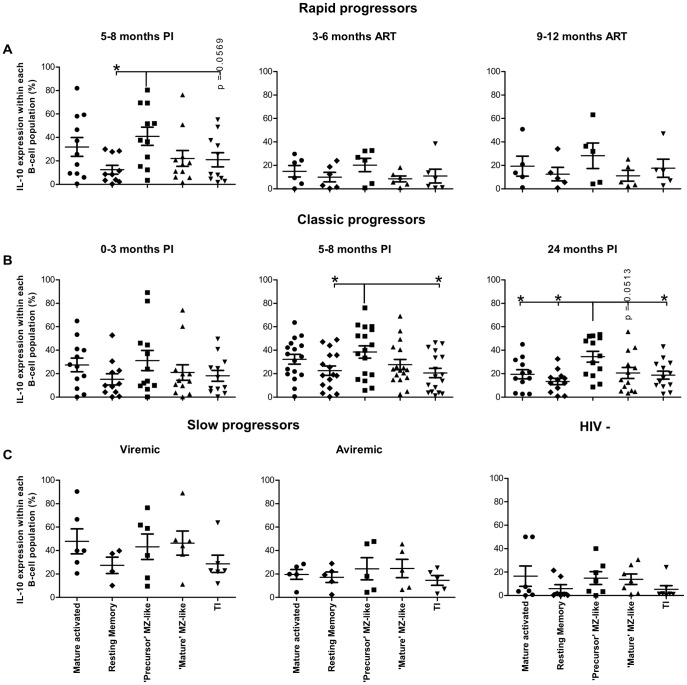
Figure 3. Percentage of IL-10 expressing cells for each B-cell population, within each patient group.
Percentage of IL-10 expressing cells within mature activated, resting switched memory, precursor marginal zone (MZ)-like, mature MZ-like and transitional immature (TI) B-cells within (A) rapid progressors (5–8 months PI (n = 11), 3–6 months ART (n = 6) and 9–12 months ART (n = 5), (B) classic progressors (0–3 months PI (n = 12), 5–8 months PI (n = 17), and 24 months PI (n = 13)), (C) slow progressors (viremic (n = 6); aviremic (n = 5)), and HIV-negative individuals (n = 7). Percentages were compared using the Mann-Whitney U test between the B-cell populations. Data shown are mean ±SEM. *p<0.05. PI, postinfection; ART, antiretroviral therapy.

