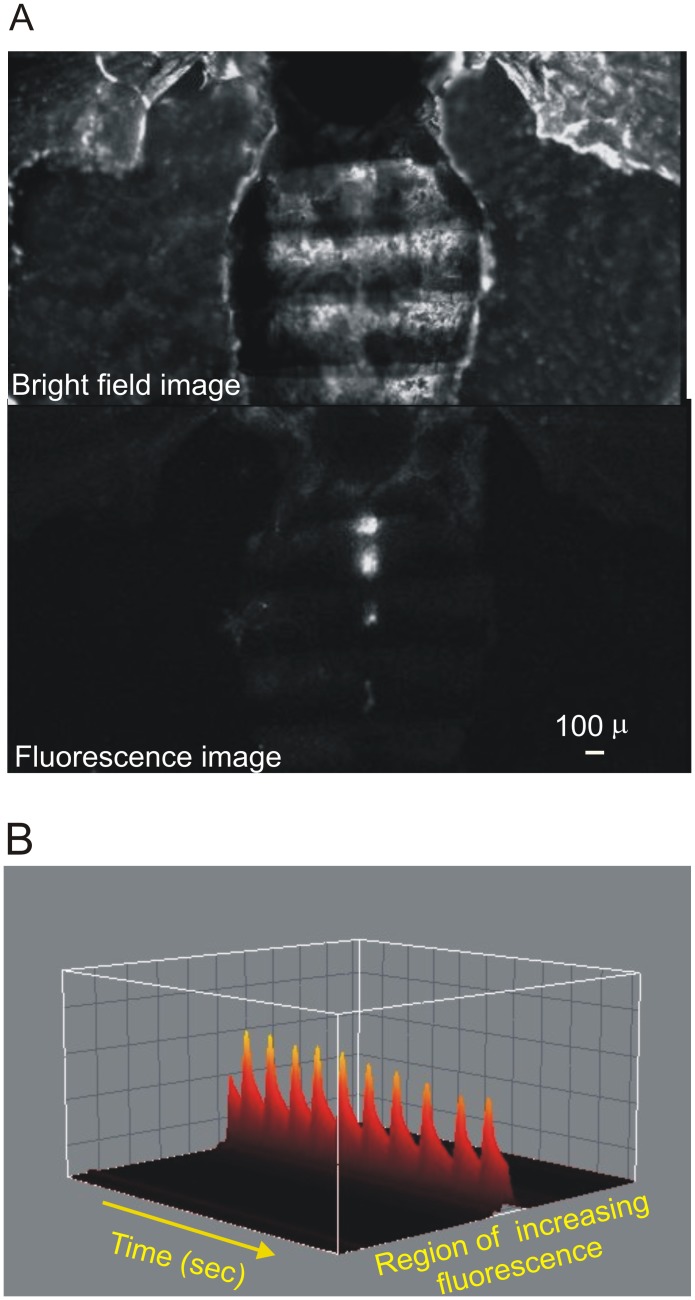
Figure 1. Visualization of fluorescence Ca2+ signal in semi intact preparations.
A. Top: Bright-field image of a fruit fly with heart exposed after removal of abdominal organs. Bottom: fluorescent signal of GCaMP3 protein that senses local increasing of Ca2+ concentration. B. 3D representation of fluorescent peak recordings on the conical chamber–first abdominal segment - along time.

