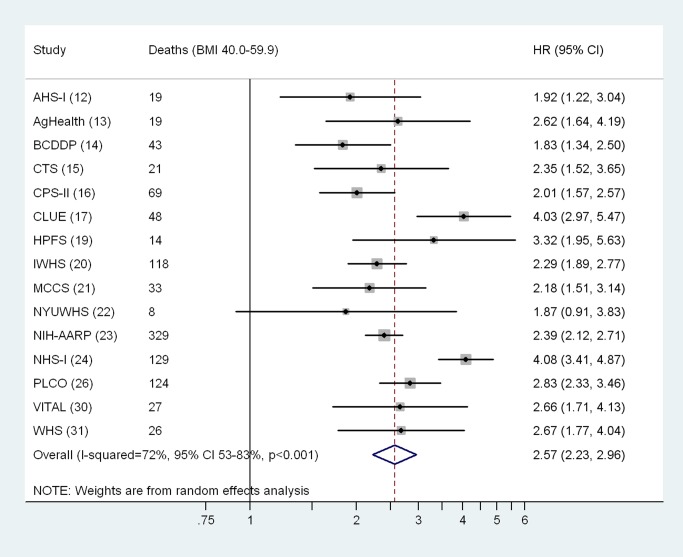
Figure 1. Cohort-specific and overall hazard ratios and 95% confidence intervals for BMI 40.0–59.9 kg/m2 versus 18.5–24.9 kg/m2.
Results for cohorts with fewer than five deaths in the BMI 40.0–59.9 kg/m2 group are not shown. Cohort-specific models use attained age as the underlying time metric, and are adjusted for sex, race/ethnicity (white [all participants in the Swedish and Australian cohorts were coded as white], black, Asian/Pacific Islander, Hispanic, other/unknown), education (high school or less, post–high school, college, unknown), alcohol intake (grams of ethanol per day: 0, >0 to <10, ≥10, unknown), and physical activity level (cohort-specific tertiles corresponding to low, medium, and high). Random effects models were used to calculate overall (pooled) HRs and 95% CIs. The cohort acronyms are identified in Table 1, and references are given in parentheses

