Figure 2.

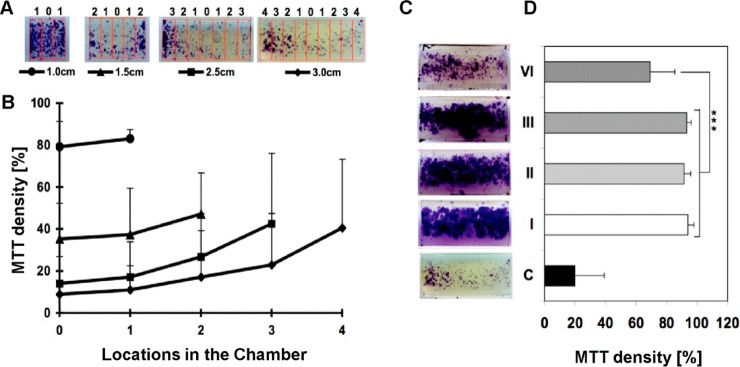
(A,B) Representative images of MTT stained astrocytes at 21 DIV within mini-chambers of different lengths (1–3 cm), showing along the top the different positions of the 0.33 cm wide analysis windows (0 at the center, maximum; four at the periphery) and below their corresponding graph symbols in B. (B) Graph showing the density of MTT stained astrocytes within each analysis window along the mini-chambers. (C) Representative images of MTT stained astrocytes at 21 DIV in 3 cm long mini-chambers with between 1 (I) and a maximum of 6 (VI) porous lids and a nonporous lid (C). (D) Graph of MTT density correlates directly to that of viable cells within the mini-chambers shown in (C). All results shown (B,D) are the mean ± SD (n = 3).
