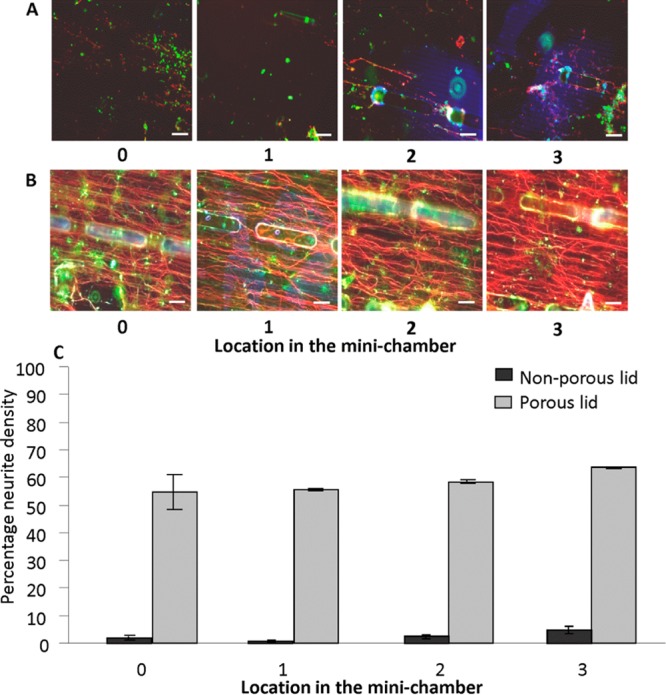
Figure 3.

(A) Representative images of a myelinating culture at different locations inside a 2.5 cm mini-chamber possessing a nonporous lid showing poor viability of cultures. (B) Representative images of a myelinating culture inside a 2.5 cm mini-chamber possessing a porous lid at different locations. (C) Graph showing mean neurite density (SMI-31 immunoreactivity), an indicator of myelinating culture viability, in each location of the 2.5 cm long mini-chamber possessing a porous lid (gray bars) and nonporous lid (black bars). All images are at 28 D.I.V., and the graph is representative of this time point. Scale bar: 100 μm. 0–3 represents locations as illustrated in Figure 2. SMI-31 (red for axons); PLP (green for myelin).
