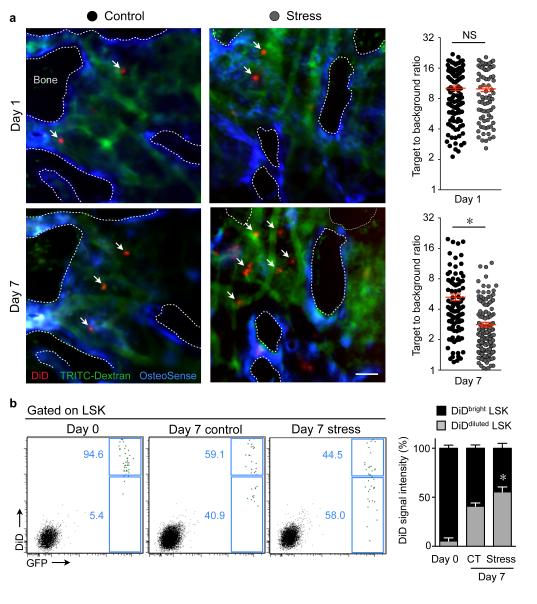
Figure 2. Hematopoietic progenitors in the bone marrow of stressed mice dilute DiD membrane dye faster.
a, Intravital microscopy of the mouse calvarium after adoptive transfer of DiD–labelled LSK (white arrows) before and seven days after stress (n = 5 mice per group, Mann–Whitney test). Dotted lines outline bone. Scale bar indicates 50 μm. Single dots in graphs represent DiD+ cells’ target–to–background ratio before (upper panel) and after stress (lower panel). b, DiD fluorescence on day 0 and 7 days after adoptive transfer of DiD+ GFP+ LSK in non–stressed control (CT) or stressed mice (n = 5 per group). The bar graph illustrates the DiD fluorescence in GFP+ LSK (Mann–Whitney test). Mean ± s.e.m., * P < 0.05.

