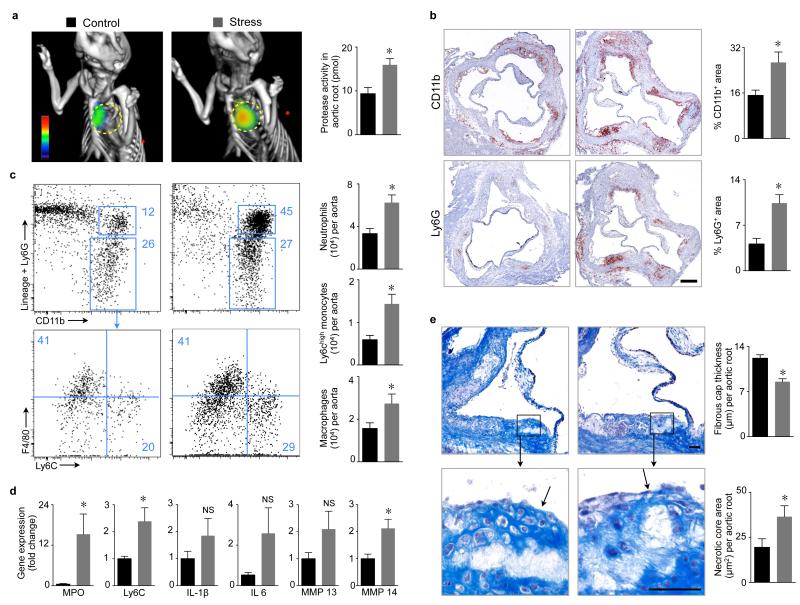
Figure 4. Chronic stress increases inflammation in mouse atherosclerotic plaques.
a, Protease activity in aortic roots of ApoE−/− mice measured by FMT–CT after 6 weeks of stress. Circles indicate aortic root (n = 5 per group, Mann–Whitney test). b, Immunoreactive staining of aortic roots for CD11b and Ly6G. Bar graphs show percentage of positive area per root (n = 9–10 per group, Student’s t–test). Scale bar indicates 200 μm. c, Gating and quantification of aortic myeloid cells (n = 10 per group, Student’s t–test). d, qPCR for inflammatory genes in aorta (n = 9–10 per group, Student’s t–test). e, Masson trichrome staining (n = 9 per group, Student’s t–test). Scale bar indicates 50 μm, arrows point at fibrous cap covering necrotic core. Bar graphs show fibrous cap thickness and necrotic core area. Mean ± s.e.m., *P < 0.05.

