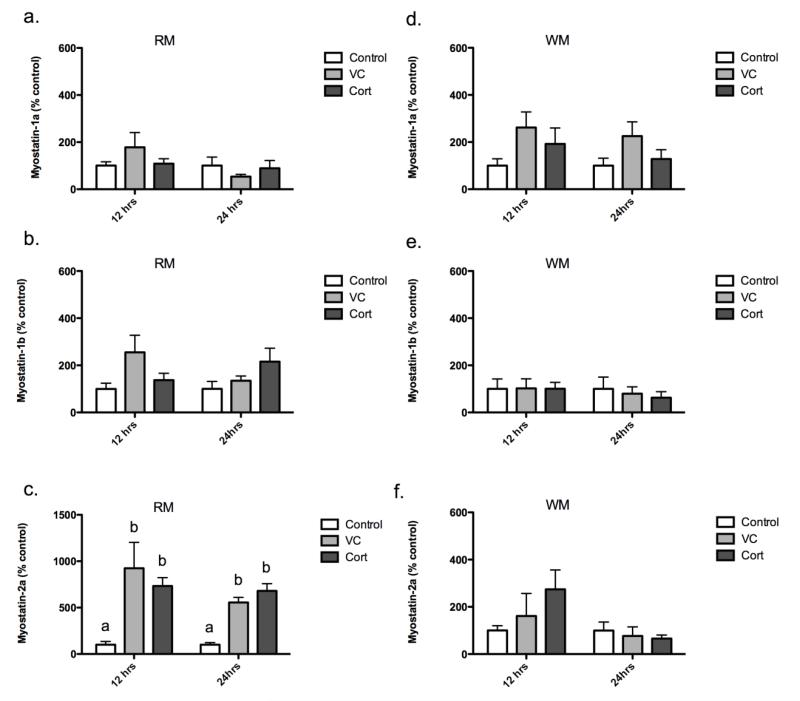
Figure 2.
Red muscle myostatin-1a (a), -1b (b), and -2a (c) mRNA levels 12 h and 24 h post-injection. White muscle myostatin-1a (d), -1b (e), and -2a (f) mRNA levels 12 h and 24 h post-injection. Results are percent-mean relative to control ± SEM (n=6 fish/trt). Treatment groups include: no injection control (Control), vehicle control (VC; 2 μL/g BW safflower oil), and cortisol (Cort; 2 μg/g BW). Different letters are significantly (P<0.05) different.

