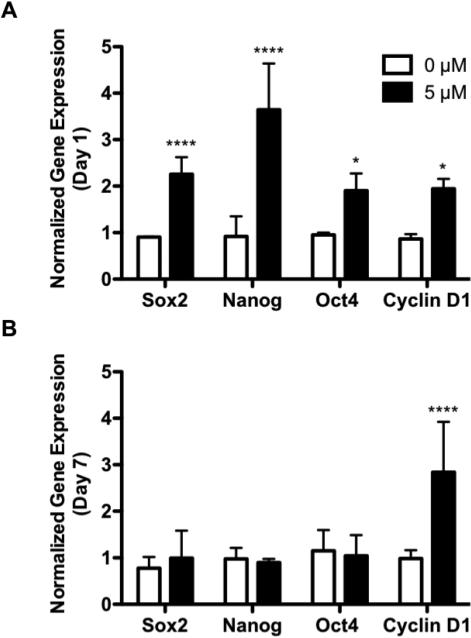
Figure 5. BIO Enhances 3D MSC Expression of Sox2, NANOG, Oct4, and Cyclin D1.
Profiles of Wnt target genes Sox2, NANOG, Oct4, and Cyclin D1 following 24 hr BIO treatment (Day 1) (A), and 6 days post-BIO treatment (Day 7) (B) of encapsulated MSCs. Profiles are normalized to the housekeeping gene β-actin and 0 μM controls, and are expressed as a ratio of initial gene expression (day 0) prior to BIO treatment (*p<0.05, ****p<0.0001 vs. 0 μM) (mean +/− SD).

