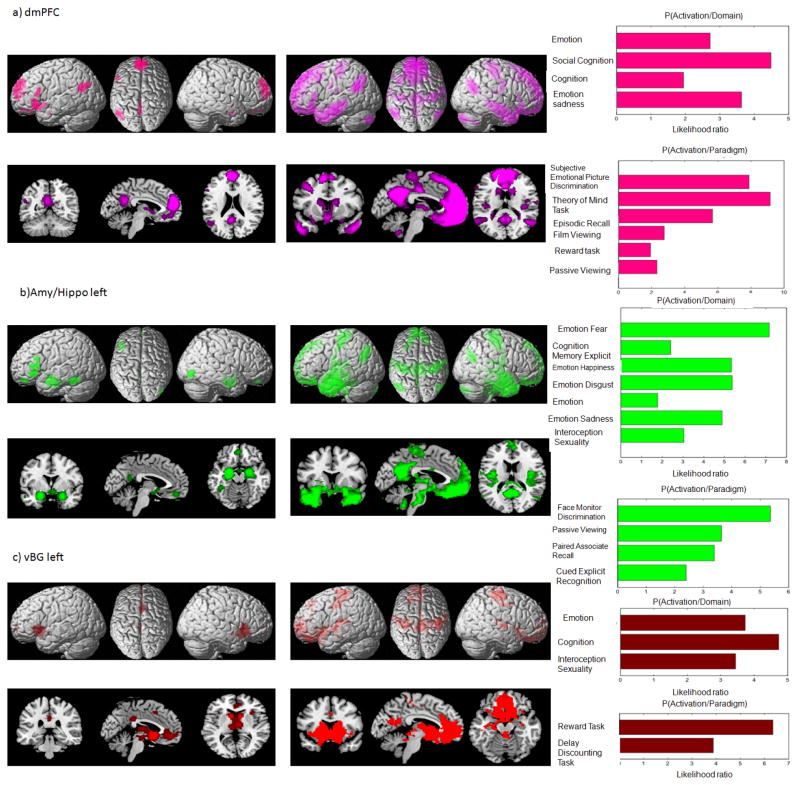
Figure 5.
Figure 5a–c. Functional characterization, MACM and resting state analysis of the eSAD regions
The panel on left column presents results of MACM analysis on surface and orthogonal sections of the MNI template. The one in the middle column illustrates results of resting state analysis. The panel on right side illustrates the functional decoding of the regions. The behavioral domains are shown on top, whereas paradigm classes are provided below.

