
Figure 1.
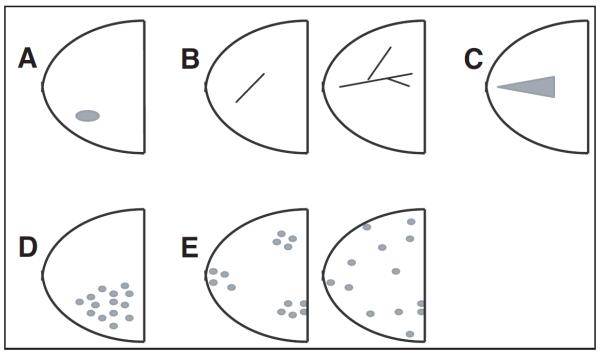
Geographic distribution of magnetic resonance imaging patterns: (A) focal = nonmass enhancement organized towards a center; (B) linear (left) ductal (right) = traces pattern of a duct or a branch; (C) segmental = triangular enhancement, apex points towards the nipple, suggesting ductal distribution; (D) regional = single quadrant enhancement not conforming to duct distribution; (E) multiregional (left, patchy; right, diffuse) = areas of enhancement in = two quadrants.